


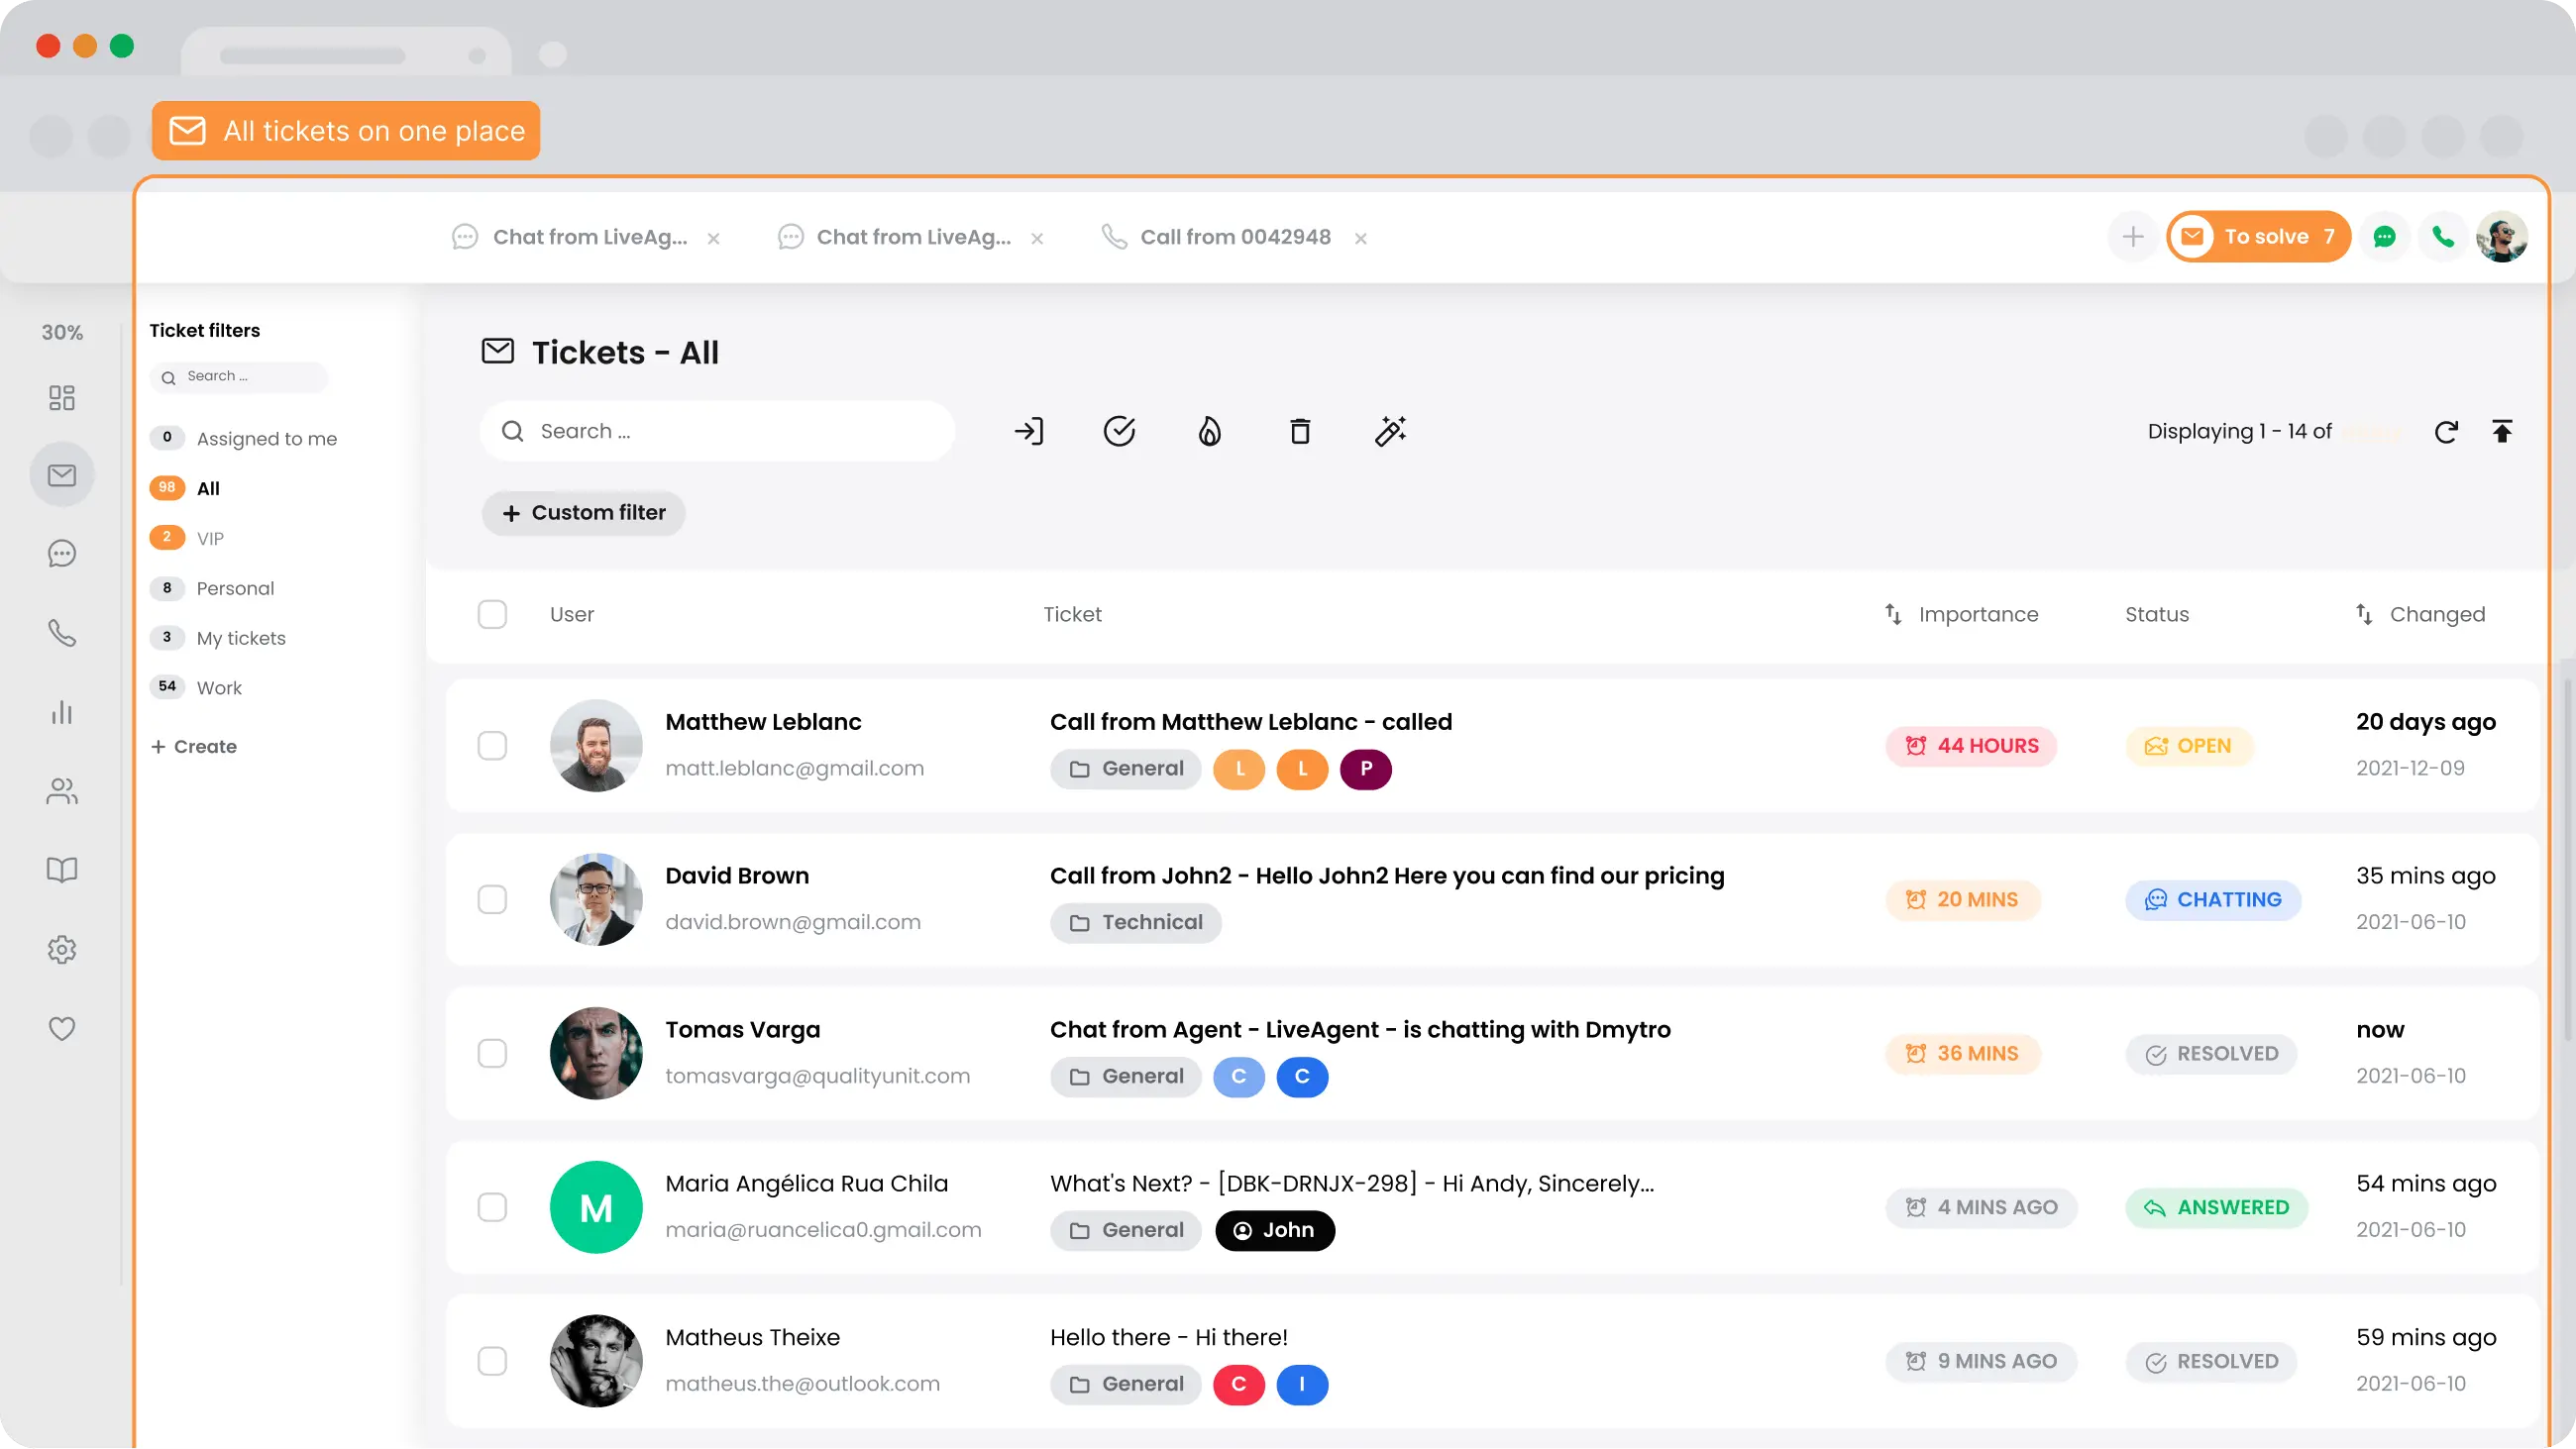


Provide the best customer care and organize your inquiries with ticketing. In this comprehensive guide, we will explore the top ticketing software solutions available, compare their features, and provide insights to help you determine which platform is right for your organization.
Cost of ticketing software
The pricing for ticketing help desk software can range from free to very expensive. This depends on many factors. You always need to consider a few things before you decide to pick a system. The costs can vary because of features and their quality, the number of custom integrations, the popularity of the selected brand, usability in various scenarios, scalability, and many other factors. There are a few pricing models that need to be considered to make sure a help desk system is worth it and suits your business model.
Pricing models of ticketing software
Per ticket
Per ticket pricing models let you pay for what you need. This pricing model is ideal for help desks with low numbers of customer tickets. The biggest downside might be a lack of motivation for agents to handle support, as every handled ticket equals a larger sum paid to the service provider.
Per license
License pricing models can include licenses for one or more users. Everyone who has it can use the software indefinitely as long as the price has been paid. The price for a license can be a lump sum or on a subscription basis.
Per device
Similar to the license pricing model, you can pay a lump sum or a subscription fee that lets you use ticketing software on multiple devices. The final sum stacks for each device used in a help desk.
Per agent
The agent-based model is the most common and the most preferred as it gives you fair conditions. Your price depends on the number of software users. They can use the software with every paid feature with no limits set by ticketing or runtime.
How to choose the best ticketing software
Commitments
Become familiar with ticketing solutions and learn about the software commitments. These include base pricing, software or hardware requirements, built-in features, integrations, supported customer communication channels, and even customer support for help desk users. Once you get all the vital information, you can make an informed decision about what software is best for your situation.
Pricing
The most common issues regarding choosing the best ticketing software for your business include pricing options. Ticketing software prices depend on a few factors, such as basic features, integrations, reliability, and more. Make sure to consider all of these options and compare pricing tiers to ensure you will get the software you need without overpaying.
Support
Any help desk software should provide stellar support for its users. Therefore, user-friendly self-service options and direct contact options are a necessity. LiveAgent customers can contact our 24/7 support line via email, live chat, or phone at any time. You can also browse through our external knowledge customer base for self-service options.
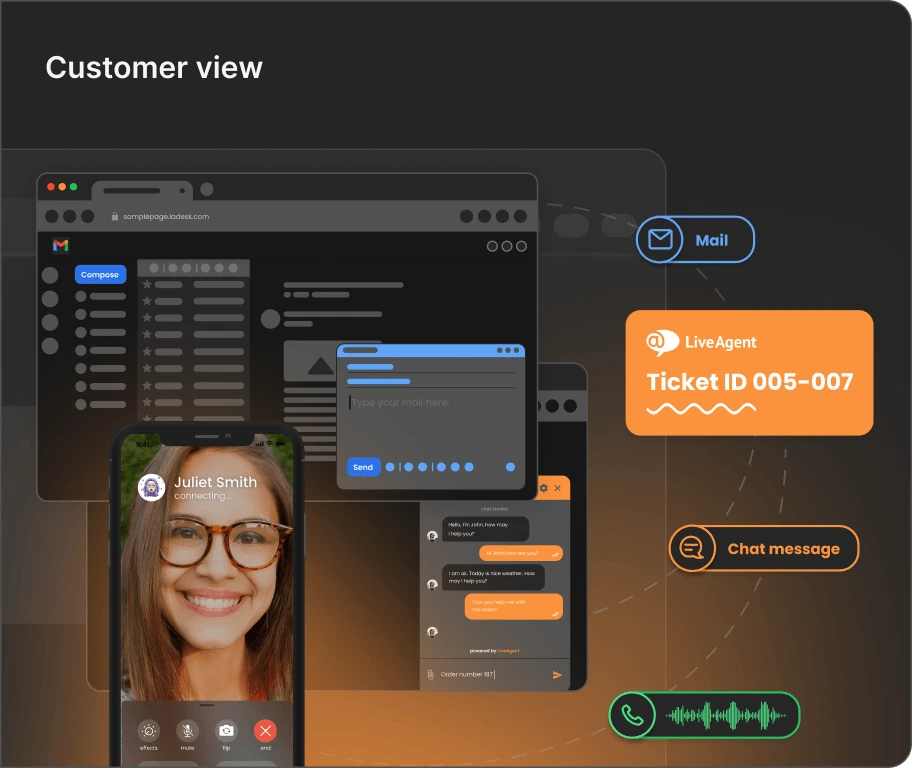
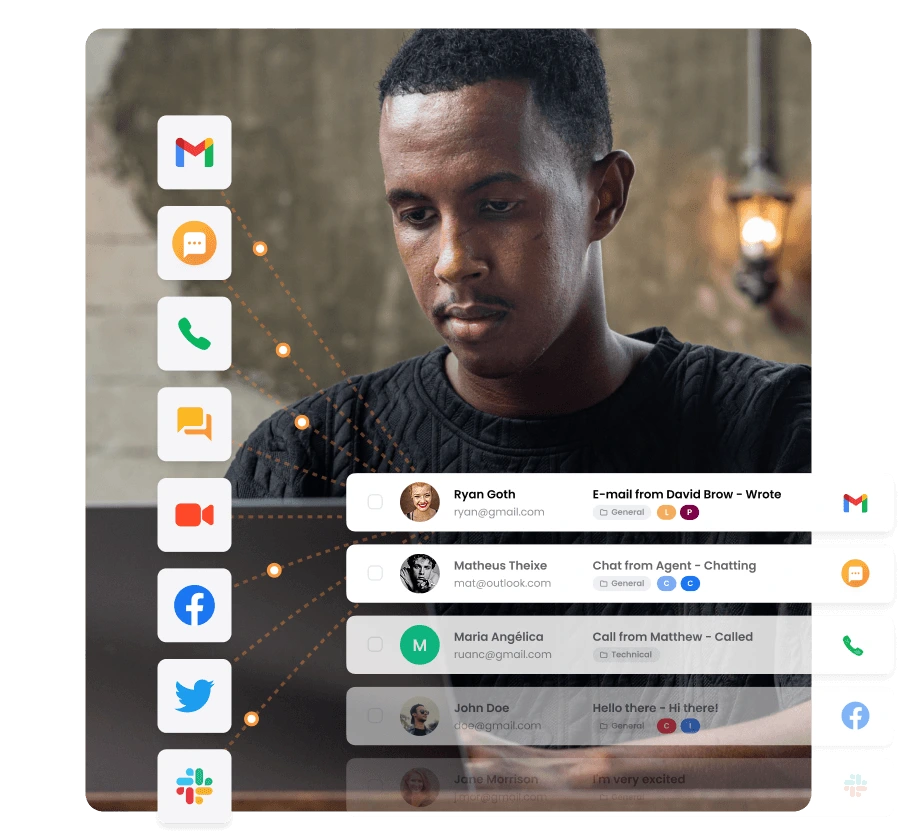
Provided contact options
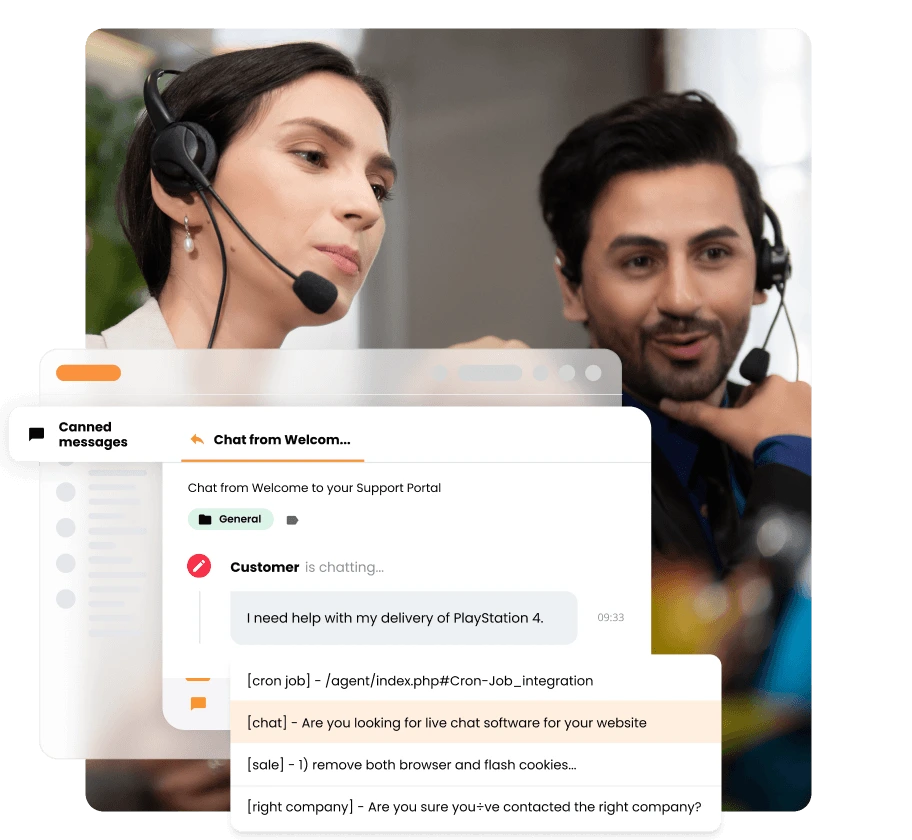
Provide stellar customer service with a selection of tools that help you reach every important customer channel. For example, give your customers the options to contact you via email, live chat, calls, or even social media. With the addition of a customer portal and external knowledge base, you can ensure your customers will find their preferred option.
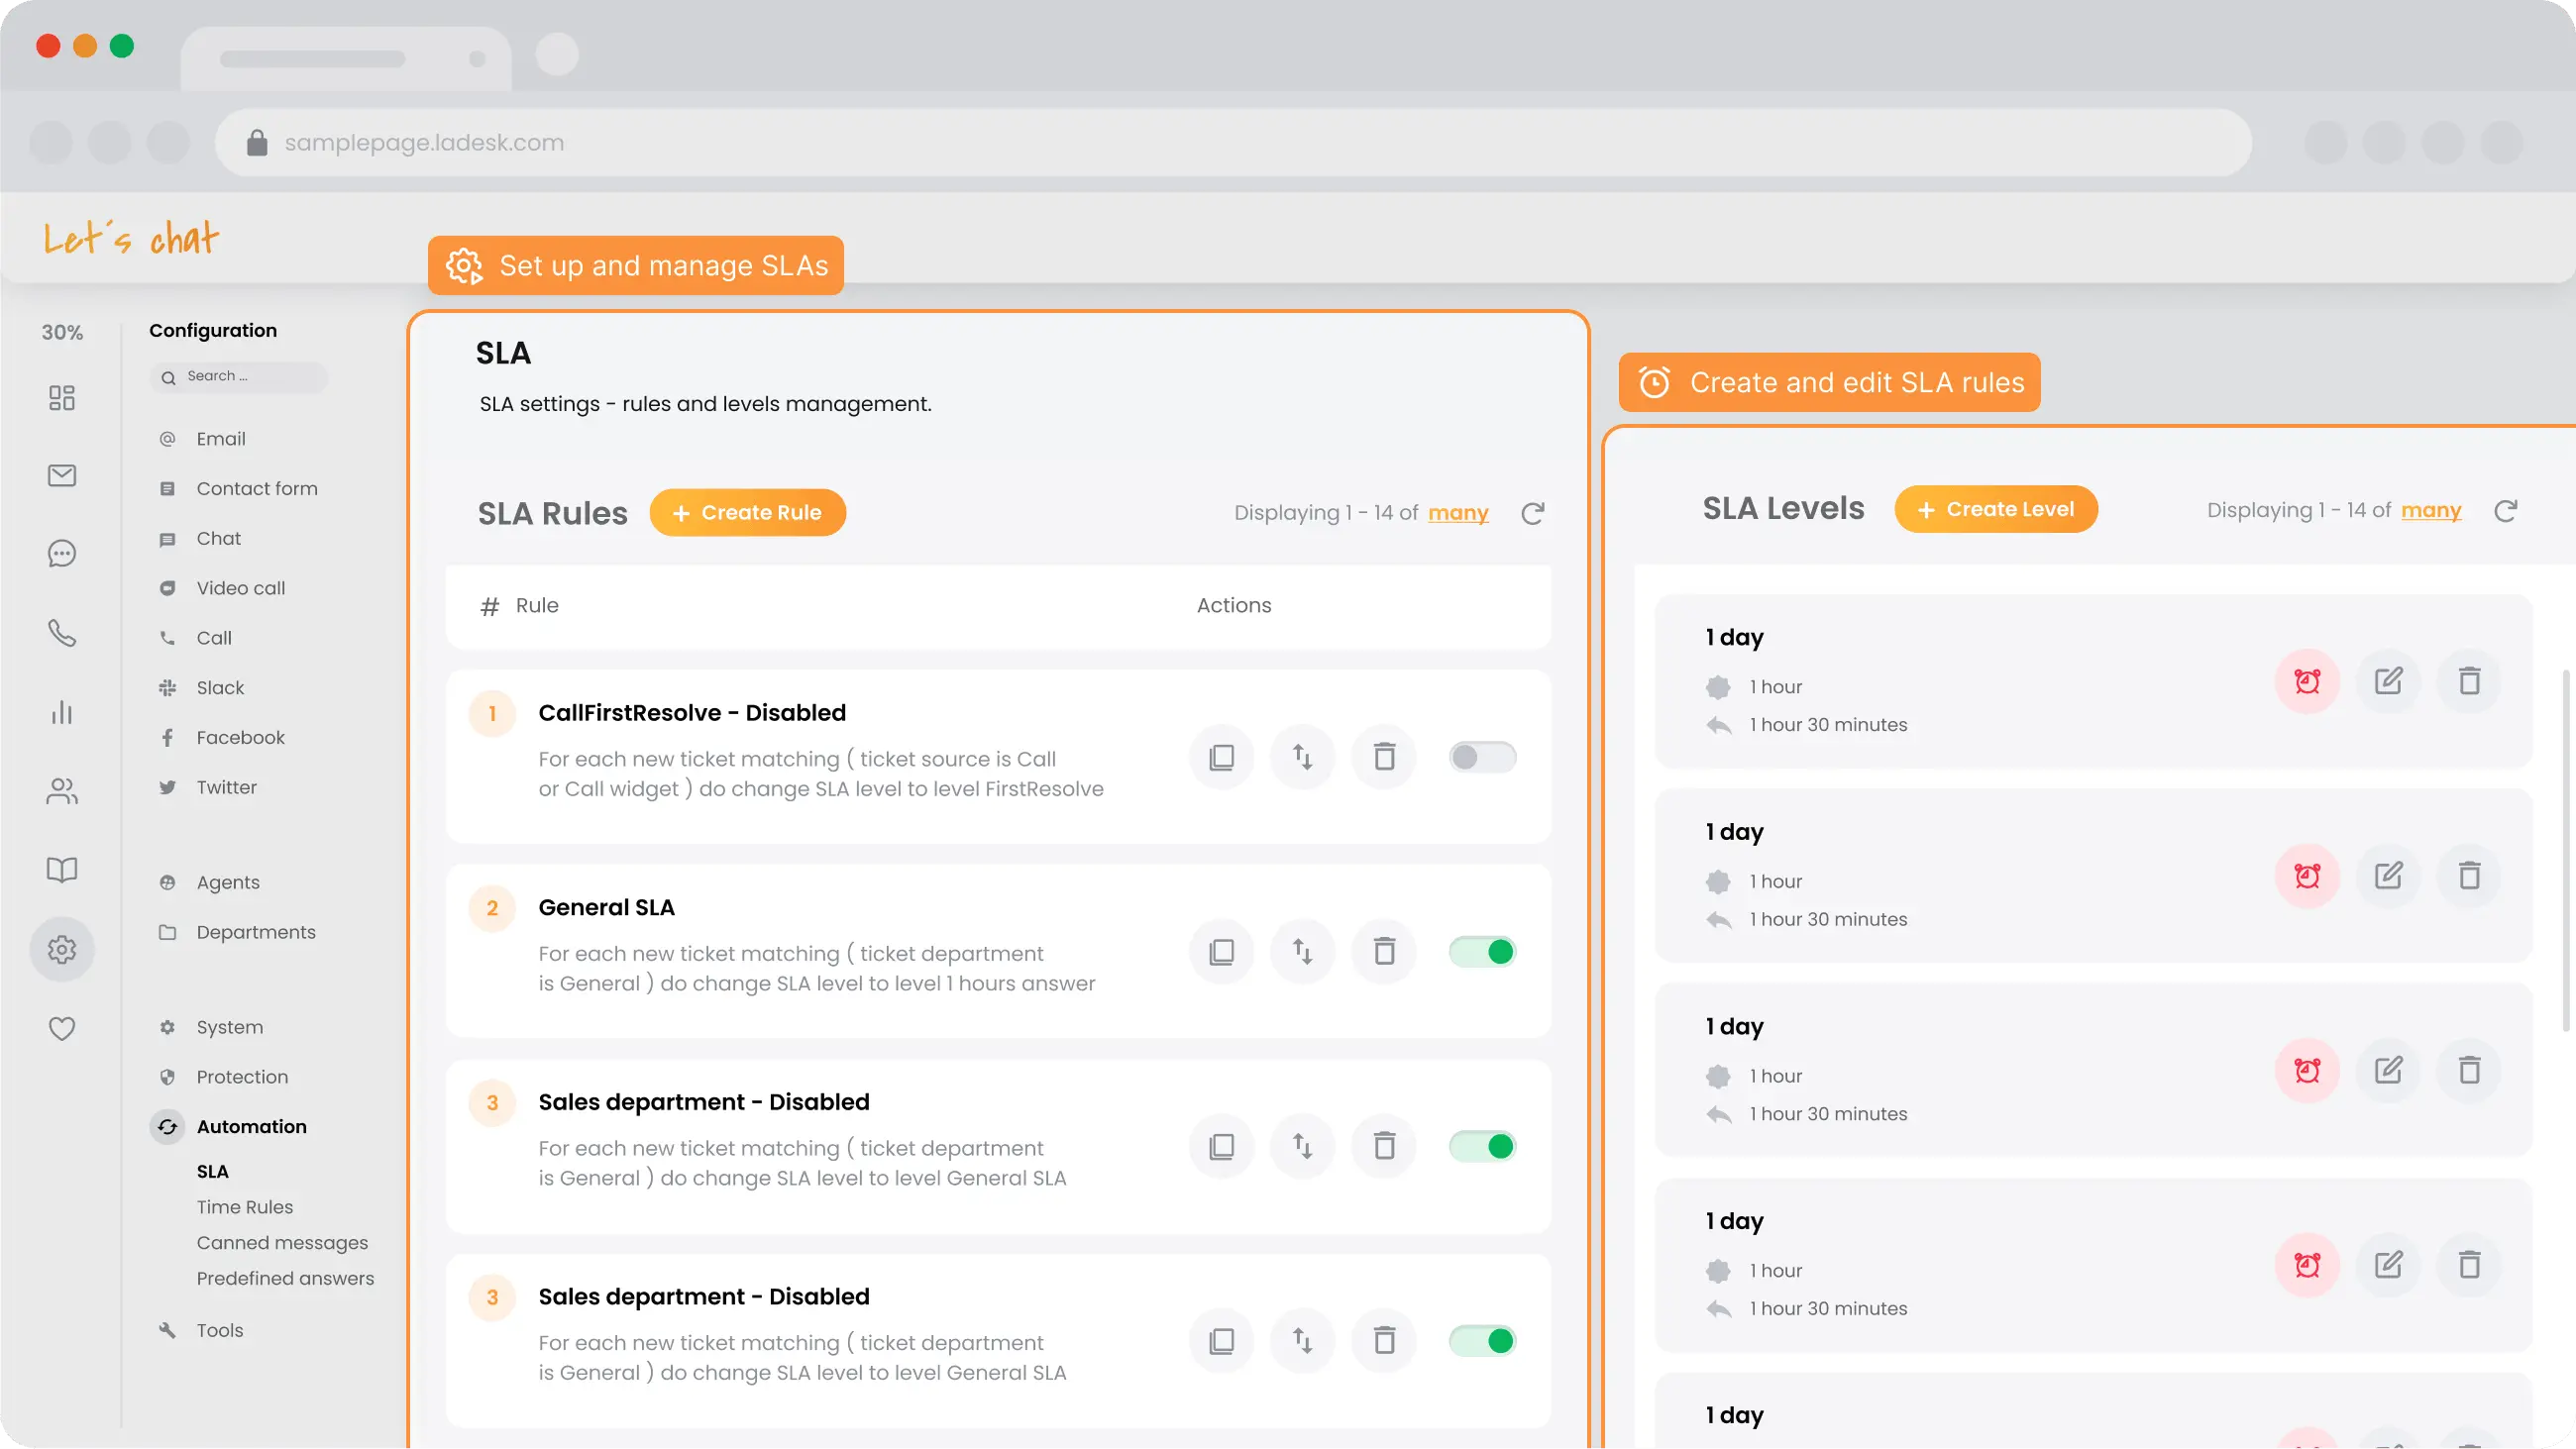
Ability to scale up/down
Are you feeling overwhelmed with incoming requests? Every good ticketing software can help you scale up whenever necessary and help you create room for more customer support agents. It works the other way around too. Feel free to downgrade whenever you feel like you’re overpaying for features you don’t use.
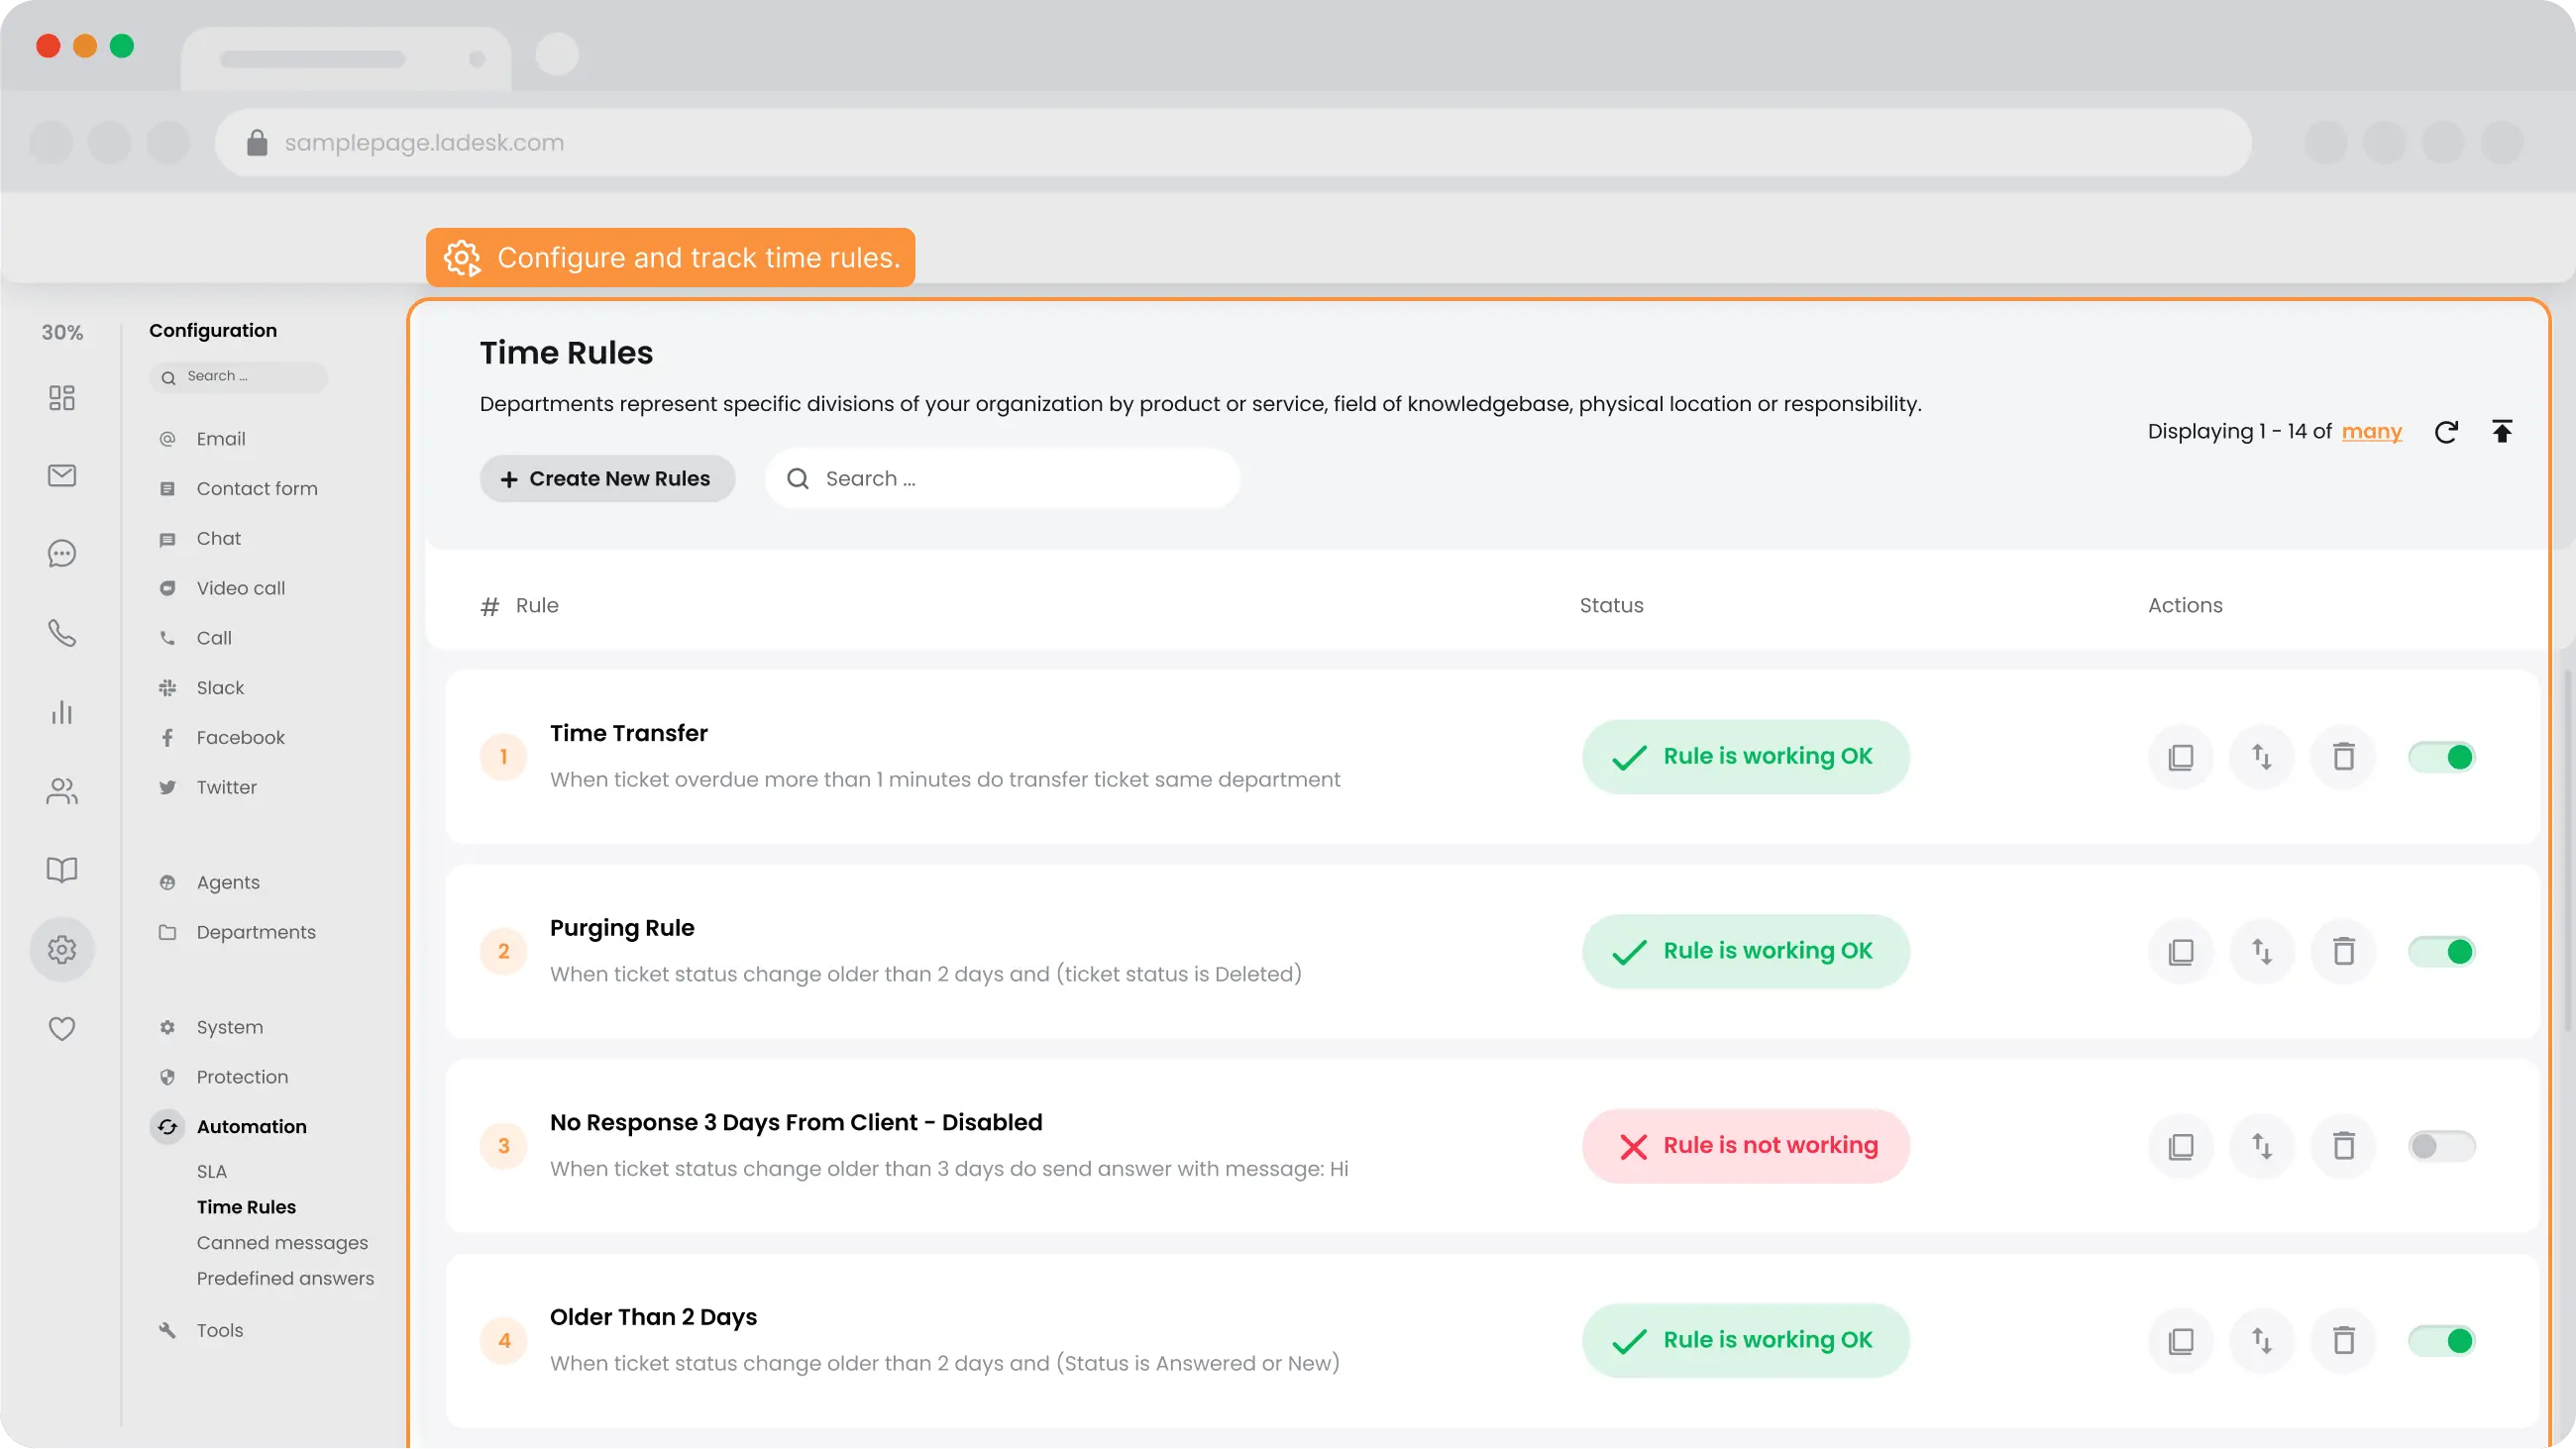
Software limitations
Your customer support team should have everything necessary to provide support. Software limitations don’t have to be a necessarily bad thing, especially for help desks that don’t require every tool and feature software can offer. Consider everything you need and pick the best options for a fair price.
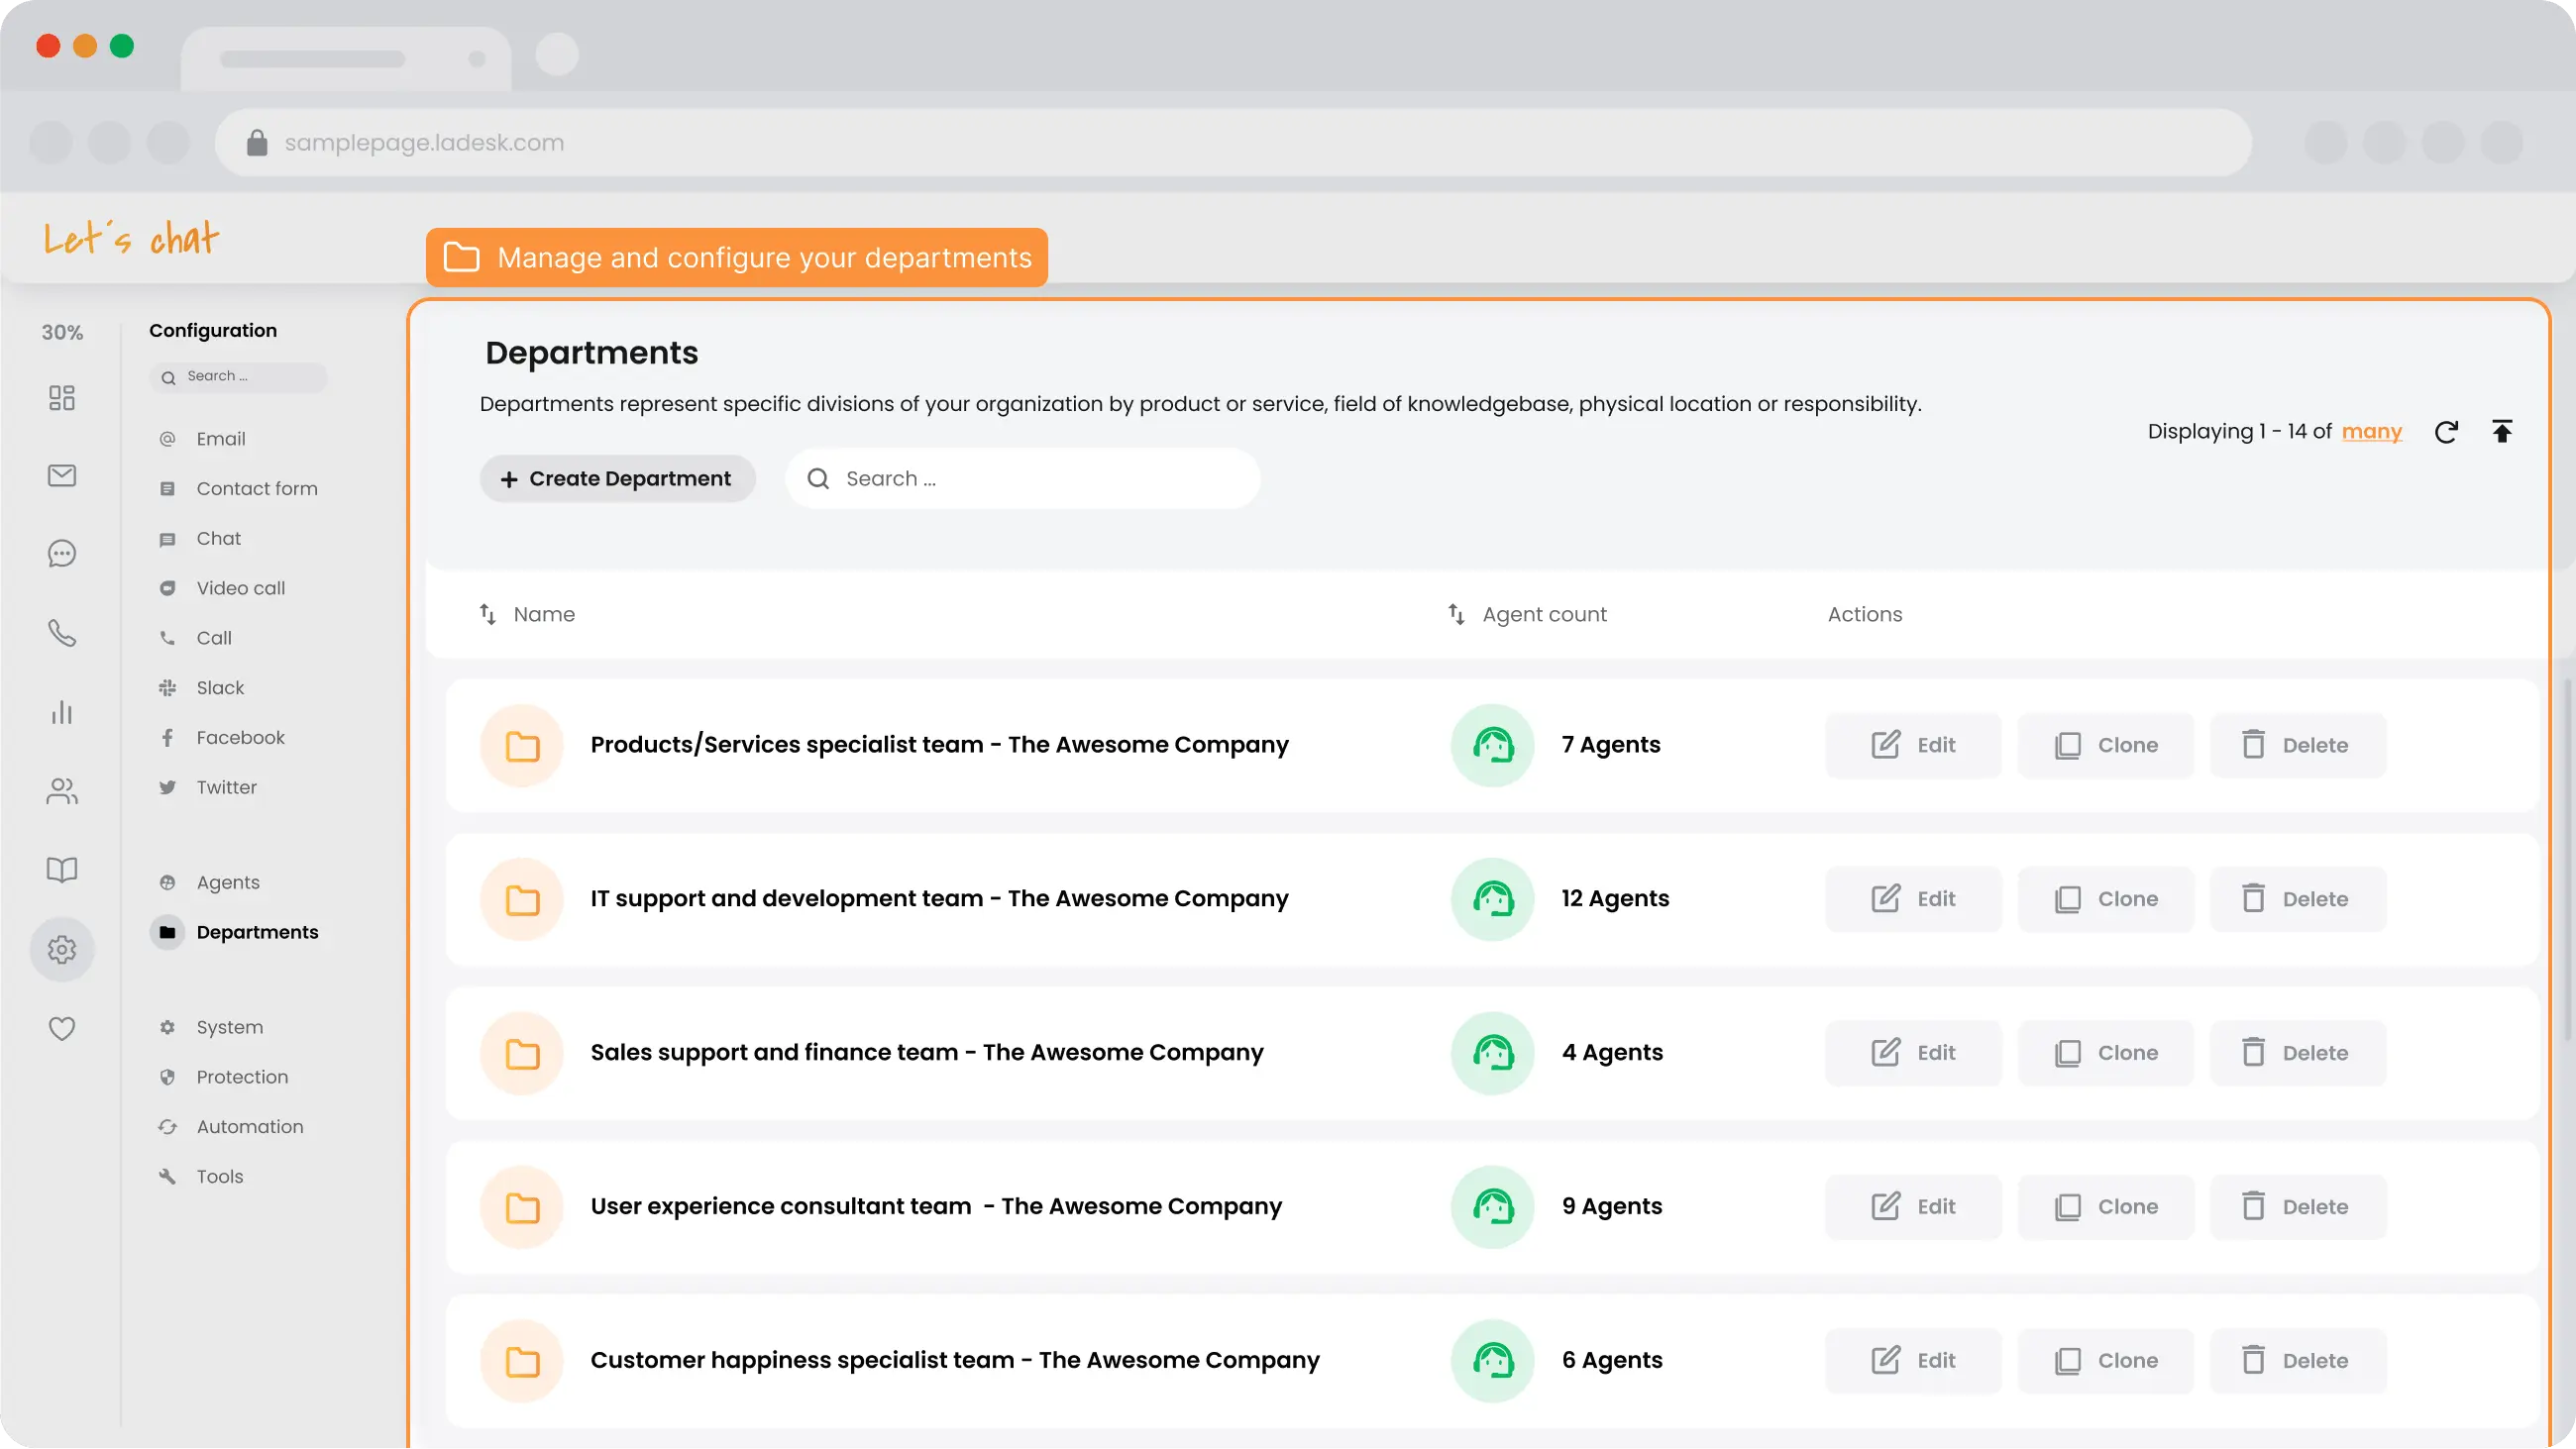
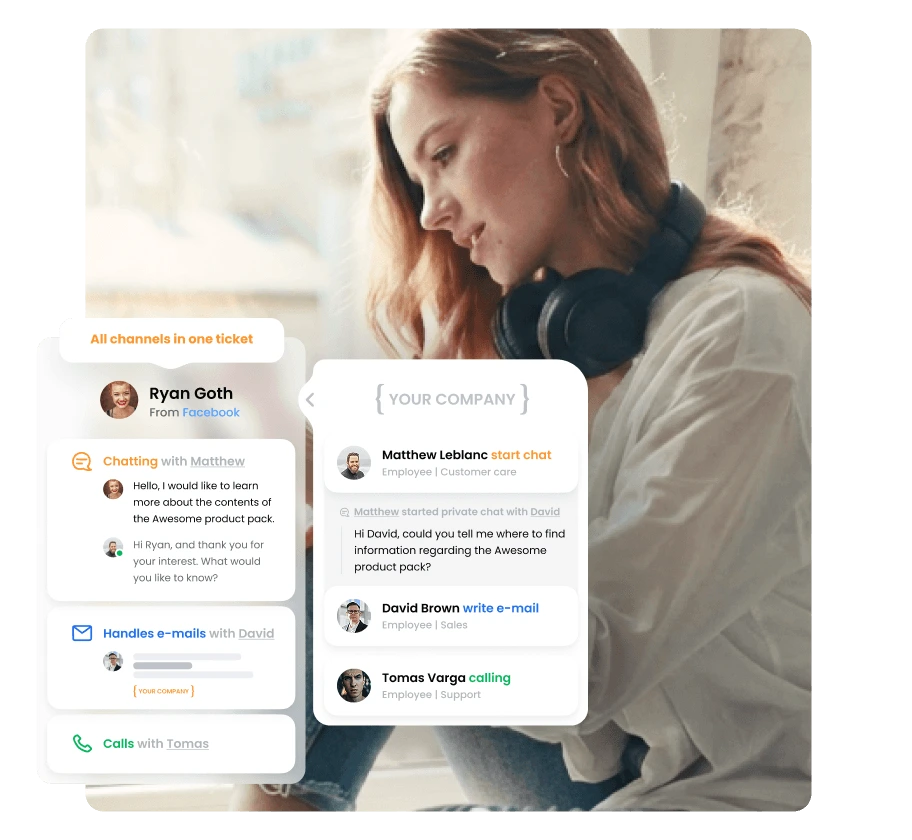
Collaboration options
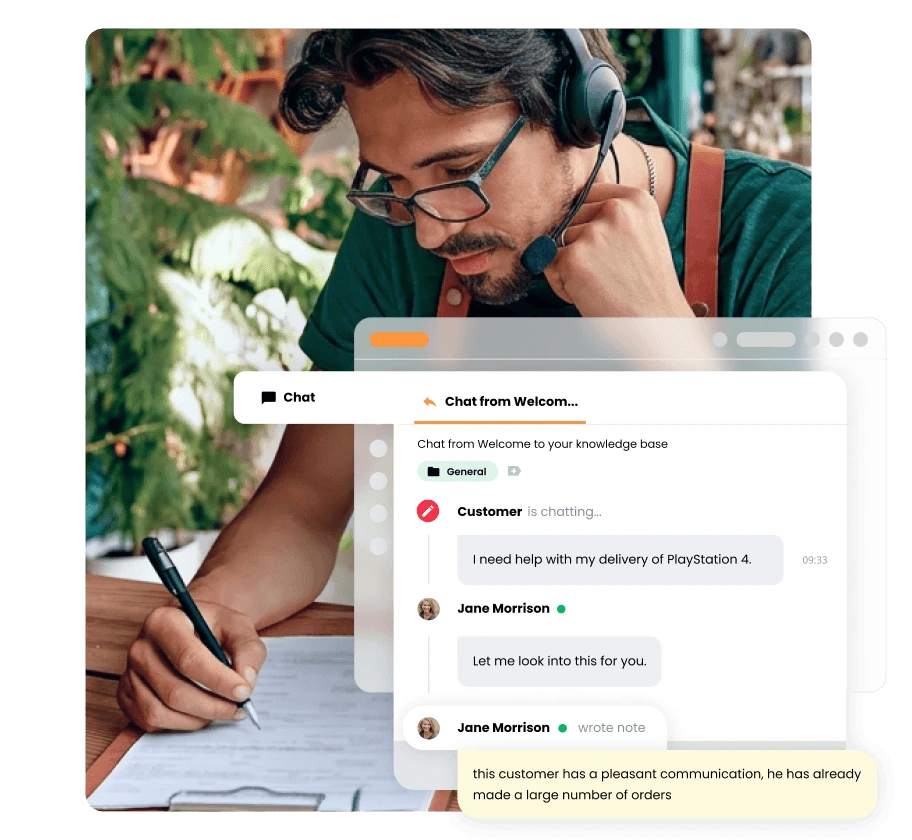
Customer service reps should work as a unit. Take advantage of help desk collaboration tools, share customer profiles, and easily cooperate on customer issues. Anyone can pitch in. LiveAgent can help you with notes, tags, contact information, and splitting customer tickets when necessary.
Top 20 providers of ticketing software
The most widely used ticketing solutions for customer support, IT service management, and helpdesk operations in 2026.