Български
  Čeština
  Dansk
Dansk  Deutsch
  Eesti
Eesti  Español
  Français
  Ελληνικα
  Hrvatski
  Italiano
  Latviešu
  Lietuviškai
  Magyar
  Nederlands
  Norsk bokmål
  Polski
  Română
  Русский
  Slovenčina
  Slovenščina
  简体中文
简体中文  Tagalog
  Tiếng Việt
  العربية
  Português


![]()
![]()
Facebook & Messenger


Viber
Slack


![]()


-
![Roman Bosch]() It’s a pleasure to have a great portal that improves our customer service.Roman Bosch
It’s a pleasure to have a great portal that improves our customer service.Roman Bosch![Partly]()
-
![Christine Preusler]() LiveAgent empowers our agents to provide better, faster, and more accurate support.Christine Preusler
LiveAgent empowers our agents to provide better, faster, and more accurate support.Christine Preusler![HostingAdvice]()
-
![Karl Dieterich]() LiveAgent helped us to achieve 2 important goals: increase customer satisfaction and sales.Karl Dieterich
LiveAgent helped us to achieve 2 important goals: increase customer satisfaction and sales.Karl Dieterich![Covomo]()
-
![Hendrik Henze]() We have been using LiveAgent since August and we are really satisfied with it.Hendrik Henze
We have been using LiveAgent since August and we are really satisfied with it.Hendrik Henze![HEWO Internetmarketing]()
-
![Razvan Sava]() Since we are using LiveAgent our response time improved by 60%.Razvan Sava
Since we are using LiveAgent our response time improved by 60%.Razvan Sava![Webmaster Deals]()
-
![Taras Baca]() Our paid customer conversion rate went up 325% the first month we've set up and actively started using LiveAgent.Taras Baca
Our paid customer conversion rate went up 325% the first month we've set up and actively started using LiveAgent.Taras Baca![XperienceHR]()
-
![Andrej Ftomin]() I have to say, I have never experienced such a professional customer approach.Andrej Ftomin
I have to say, I have never experienced such a professional customer approach.Andrej Ftomin![TAZAR Group]()
-
![Matt Janaway]() We find LiveAgent to be the best live chat solution by far.Matt Janaway
We find LiveAgent to be the best live chat solution by far.Matt Janaway![The Workplace Depot]()
-
![Viviane Carter]() We use LiveAgent on all of our ecommerce websites. The tool is easy to use and improves our productivity.Viviane Carter
We use LiveAgent on all of our ecommerce websites. The tool is easy to use and improves our productivity.Viviane Carter![CSI Products]()
-
![Christian Lange]() With LiveAgent we’re able to give our customers support wherever they are.Christian Lange
With LiveAgent we’re able to give our customers support wherever they are.Christian Lange![Lucky-Bike]()
-
![Jens Malmqvist]() I can recommend LiveAgent to anyone interested in making their customer service better and more effective.Jens Malmqvist
I can recommend LiveAgent to anyone interested in making their customer service better and more effective.Jens Malmqvist![Projure]()
-
![Catana Alexandru]() I'm sure we would spend 90% of our day sorting through emails if we didn't have LiveAgent.Catana Alexandru
I'm sure we would spend 90% of our day sorting through emails if we didn't have LiveAgent.Catana Alexandru![Websignal]()
-
![Jan Wienk]() With LiveAgent we are able to keep our players happy by offering more efficient support resulting in higher return rates.Jan Wienk
With LiveAgent we are able to keep our players happy by offering more efficient support resulting in higher return rates.Jan Wienk![All British Casino]()
-
![Allan Bjerkan]() LiveAgent is reliable, reasonably priced, and simply a great choice for any fast-paced online business!Allan Bjerkan
LiveAgent is reliable, reasonably priced, and simply a great choice for any fast-paced online business!Allan Bjerkan![Norske Automaten]()
-
![Sissy Böttcher]() We like it because it is easy to use and offers great functionality, such as useful reporting features.Sissy Böttcher
We like it because it is easy to use and offers great functionality, such as useful reporting features.Sissy Böttcher![Study Portals]()
-
![Peter Koning]() We love LiveAgent - it makes supporting our customers easy.Peter Koning
We love LiveAgent - it makes supporting our customers easy.Peter Koning![TypoAssassin]()
-
![Aranzazu F]() We like to offer our customers the best support experience. That’s why we chose LiveAgent.Aranzazu F
We like to offer our customers the best support experience. That’s why we chose LiveAgent.Aranzazu F![Factorchic]()
-
![Rick Nuske]() From setup to ongoing support and everything else in between, the team at LiveAgent continues to impress.Rick Nuske
From setup to ongoing support and everything else in between, the team at LiveAgent continues to impress.Rick Nuske![MyFutureBusiness]()
-
![Vojtech Kelecsenyi]() LiveAgent saves us hundreds of precious minutes every day by making customer service clear and in order.Vojtech Kelecsenyi
LiveAgent saves us hundreds of precious minutes every day by making customer service clear and in order.Vojtech Kelecsenyi![123-Nakup]()
-
![Rafael Kobalyan]() Unlimited agents, email, social media, and phone integration. All that for less than we were paying with our previous provider.Rafael Kobalyan
Unlimited agents, email, social media, and phone integration. All that for less than we were paying with our previous provider.Rafael Kobalyan![Betconstruct]()
-
![Martin Drugaj]() We’ve been using LiveAgent since 2013. We can't imagine working without it.Martin Drugaj
We’ve been using LiveAgent since 2013. We can't imagine working without it.Martin Drugaj![Atomer]()
-
![Ivan Golubović]() It's a cost-effective solution that can help you with a large amount of support requests via different channels.Ivan Golubović
It's a cost-effective solution that can help you with a large amount of support requests via different channels.Ivan Golubović![AVMarket]()
-
![Rustem Gimaev]() Answering emails from Outlook was so hard to manage. With LiveAgent we're sure every email is answered in time.Rustem Gimaev
Answering emails from Outlook was so hard to manage. With LiveAgent we're sure every email is answered in time.Rustem Gimaev![Antalya Consulting Language Center]()
-
![Randy Bryan]() LiveAgent is so awesome. With very little time and effort I had it up and running smoothly in a few...Randy Bryan
LiveAgent is so awesome. With very little time and effort I had it up and running smoothly in a few...Randy Bryan![tekRESCUE]()
-
![Timothy G. Keys]() I highly recommend the LiveAgent product, not only as a Kayako alternative but a much better solution with added value.Timothy G. Keys
I highly recommend the LiveAgent product, not only as a Kayako alternative but a much better solution with added value.Timothy G. Keys![Marietta Corporation]()
-
![Mihaela Teodorescu]() The support team always responded promptly with quick to implement solutions.Mihaela Teodorescu
The support team always responded promptly with quick to implement solutions.Mihaela Teodorescu![eFortuna]()
-
![Hilda Andrejkovičová]() It helps us categorize the nature of the tickets and statistically track what our clients need most.Hilda Andrejkovičová
It helps us categorize the nature of the tickets and statistically track what our clients need most.Hilda Andrejkovičová![TrustPay]()
-
![Alexandra Danišová]() We see LiveAgent as a great tool for communicating with customers.Alexandra Danišová
We see LiveAgent as a great tool for communicating with customers.Alexandra Danišová![Nay]()
-
![Samuel Smahel]() LiveAgent sped up our communication with our customers and gave us an option to chat with them as well.Samuel Smahel
LiveAgent sped up our communication with our customers and gave us an option to chat with them as well.Samuel Smahel![m:zone]()
-
![David Chandler]() Simply put - LiveAgent beats everything out there at this, or even higher, price-points.David Chandler
Simply put - LiveAgent beats everything out there at this, or even higher, price-points.David Chandler![Volterman]()


Key definitions of social media customer service software
Social media customer service software is a specialized tool designed to manage customer interactions across various social media platforms. By centralizing messages and brand mentions from platforms like Messenger, X (formerly Twitter), and WhatsApp Business, it streamlines the customer communication process.
This software often includes advanced features such as automation, analytics, and integration capabilities to enhance the customer experience. Key capabilities include omnichannel coverage, conversational AI, routing and deflection, social listening, and sentiment analysis. These features enable businesses to provide timely, consistent, and data-driven support.
By using social media customer service software, companies can foster higher levels of customer satisfaction and loyalty. Offering a unified view of all customer interactions across channels, it helps in understanding customer needs and delivering personalized service efficiently.
Unique features of social media customer service software
Key features include omnichannel coverage, which maintains a consistent conversation history across all platforms. This feature is crucial for understanding the context of customer interactions and provides a smoother customer service experience.

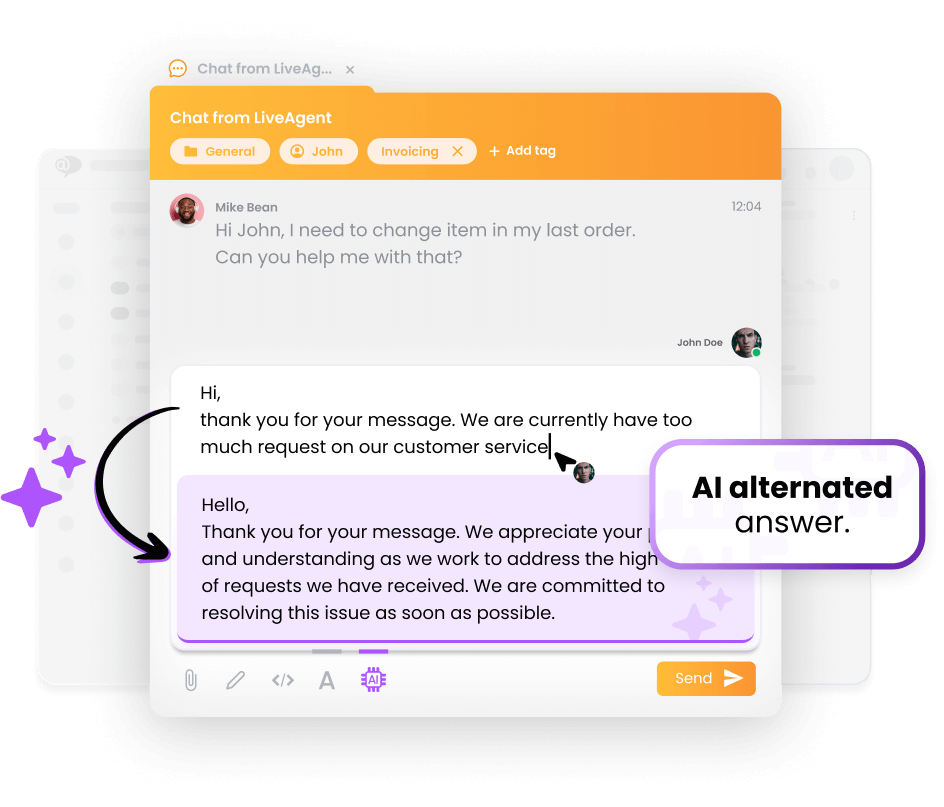
Incorporating conversational AI, the software automates real-time responses to common queries, delivering instant support. This capability reduces response times and ensures that customers receive the help they need promptly.
Social listening tools monitor brand mentions and keywords, allowing businesses to engage proactively and manage issues effectively. Furthermore, sentiment analysis capabilities help prioritize urgent feedback by identifying emotional tones in customer messages, ensuring quicker resolution and enhanced customer satisfaction.
Benefits of social media customer service software
Automation of routine tasks like ticket creation and routing significantly boosts the efficiency of customer service teams, freeing agents to tackle more complex issues.

Centralizing interactions from diverse social platforms into one interface allows for quick query identification, prioritization, and resolution, leading to markedly faster response times.
Integrated analytics tools further assist businesses in understanding customer preferences and behaviors, thus fostering more personalized interactions and ensuring industry-specific compliance in tracking customer interactions.
Enhanced customer satisfaction
Social media customer service software significantly boosts customer satisfaction by offering efficient, personalized, and proactive support tailored to individual needs.
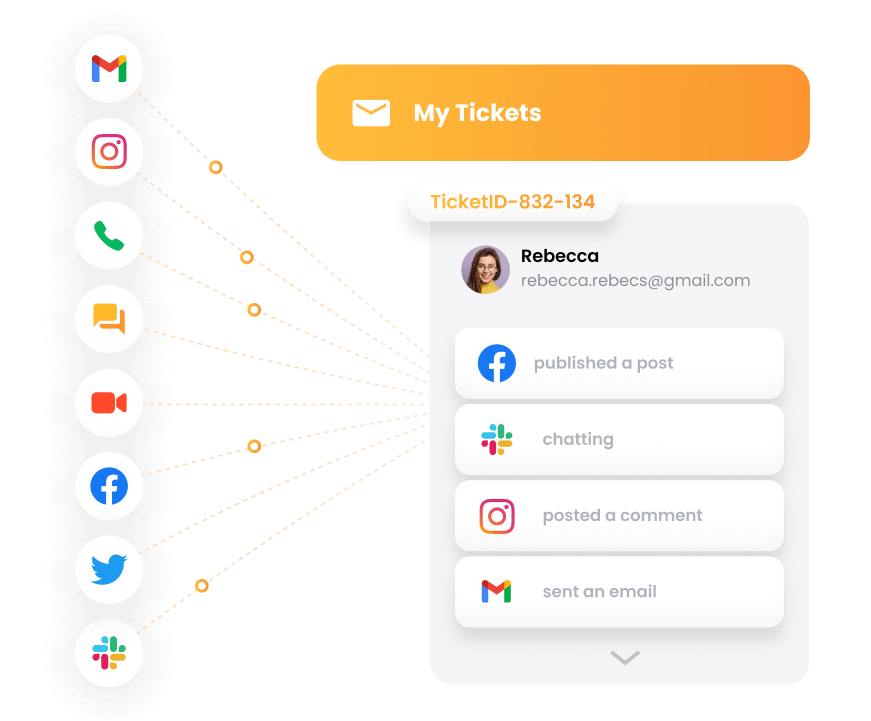
Enhanced customer interactions enabled by these tools lead to quicker issue resolution and higher retention rates. Unified inbox management aggregates inquiries from various social media channels, ensuring effective and prompt responses.

With advanced query categorization and routing, inquiries are directed to suitable agents, improving response times and resolution rates. By leveraging detailed customer history, agents deliver a personalized service experience, further heightening customer satisfaction.
Streamlined communication
Streamlined communication is achieved by integrating direct message interactions from social media with other customer service channels, including calls, email, and chats, into a unified system.

This unified approach gives customer service teams the necessary context for faster and more effective responses to inquiries.
Prompt engagement is key, with statistics showing that about 70% of consumers expect responses within 24 hours. Supporting multi-channel communication allows customers to interact on their preferred platforms, ensuring a consistent experience and enhancing operational efficiencies across social media platforms.
Proactive support through social listening
Proactive customer service on social media involves active monitoring and engagement by tracking brand mentions, hashtags, and relevant keywords rather than solely responding to direct queries.
Social listening allows brands to track both direct and indirect mentions, enabling timely interventions to prevent issues from escalating. By conducting sentiment analysis, companies gain deeper insights into customer perceptions, which inform product development and enhance customer service.
Real-time insights from social listening reveal customer demographics and attitudes, helping businesses identify and address common pain points. Engaging with customers based on mentions shows a brand’s commitment to valuing feedback and achieving satisfaction, even beyond direct inquiries.
Challenges in implementing these solutions
Training employees to use these tools efficiently is crucial. It involves developing robust communication protocols while ensuring data security compliance. Additionally, establishing metrics to measure the success of social media customer service software can be tough if existing performance benchmarks are not well-defined. Choosing the right software can also be difficult due to varying features and price points among available solutions.

Integration complexity
Integration complexity is a significant hurdle when implementing social media customer service solutions. Gladly’s platform facilitates seamless integration with other tools, boosting productivity by managing social media interactions efficiently.
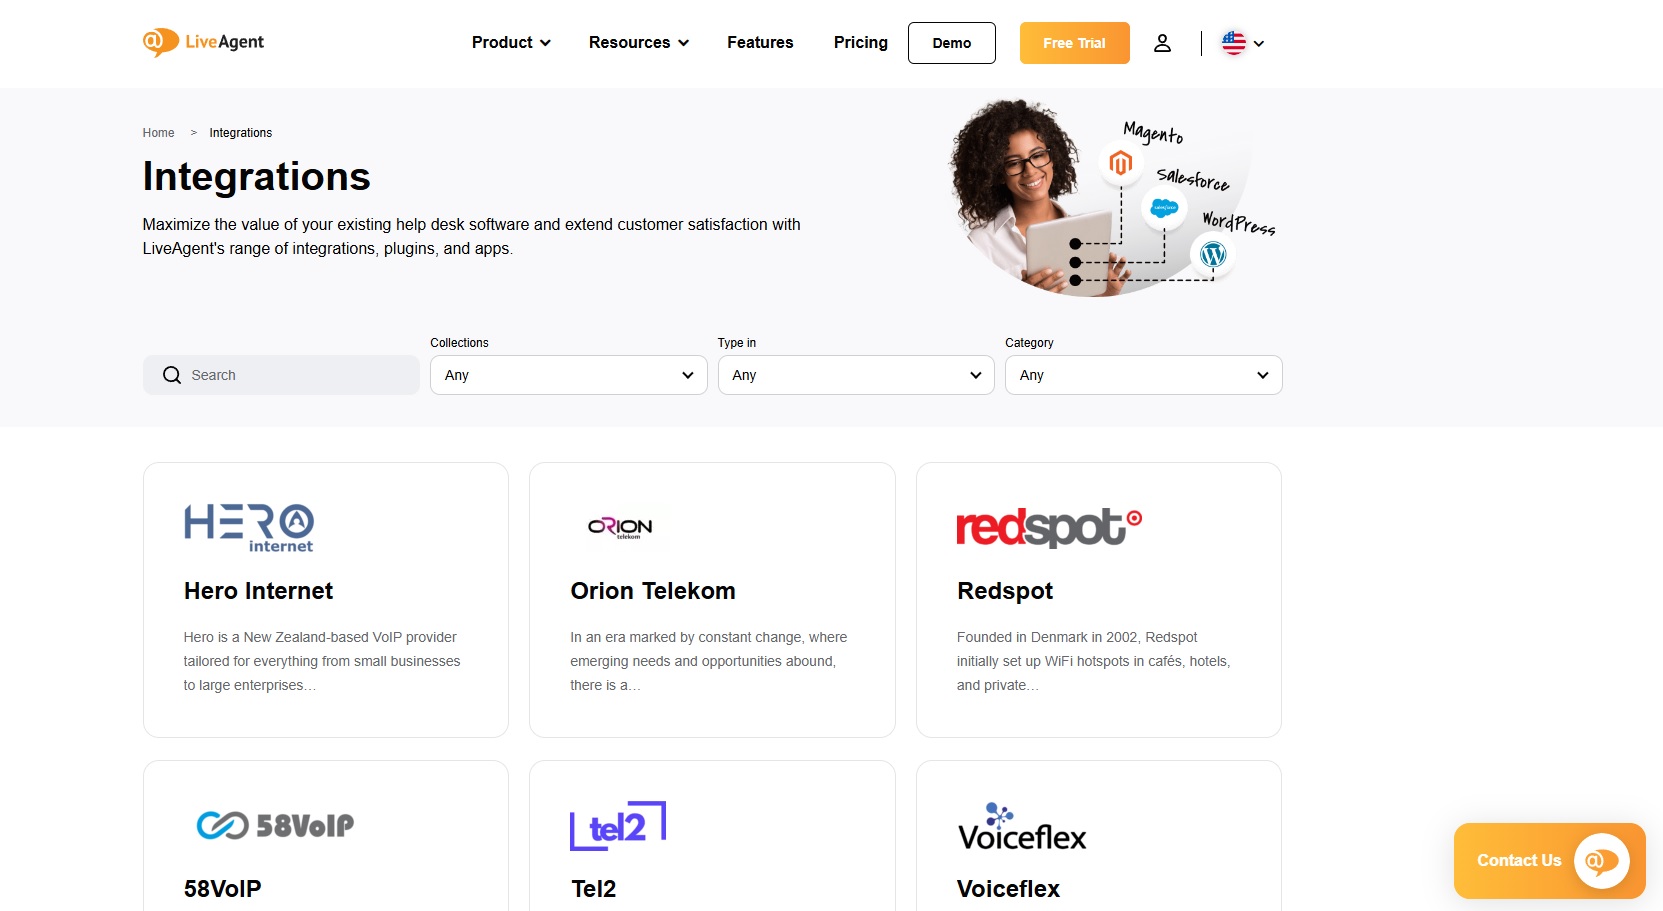
The inclusion of self-service tools and AI-based automation helps scale social customer care effectively. On the other hand, Sprout Social allows simultaneous management of various social media accounts, simplifying the handling of diverse interactions. Overall, centralized messaging from different social platforms simplifies addressing customer communication.
Managing high volumes of interactions
Social media customer service software is essential for handling high volumes of customer interactions. Smart automations manage customer inquiries effectively, reducing the burden on support teams.
Real-time monitoring features provide immediate alerts, allowing for quick responses to large volumes of queries. By aggregating customer inquiries into a unified inbox, support teams can efficiently manage interactions across multiple social media channels.
Query categorization and routing ensure inquiries reach the most suitable agents, enhancing response times even during peak periods. Detailed logs of customer history enable context-aware interactions, improving agents’ capability to address numerous inquiries effectively.
Key features to look for in software
Effective social media customer service software should provide omnichannel coverage, enabling seamless support across various platforms while maintaining consistent conversation history for customer interactions.
The inclusion of conversational AI is crucial, automating real-time responses for immediate and intelligent support for common customer questions. Additionally, advanced routing and deflection capabilities efficiently direct inquiries to the appropriate support channel or agent, optimizing response efficiency and improving customer satisfaction.
Tools for social listening, such as tracking brand mentions and keywords on social media, are essential for proactive engagement and effective issue management. Incorporating sentiment analysis in the software helps identify the emotional tone of customer messages, allowing teams to prioritize urgent or negative feedback for swift resolution.
User-friendly interface
A user-friendly interface is vital for any social media customer service platform. It should enable customer service teams to easily navigate between social media accounts and swiftly handle customer interactions. An intuitive dashboard that aggregates all customer inquiries and conversations in one place can significantly enhance team productivity.
Ensuring simplicity in design without compromising functionality allows for faster adoption and ease of use among team members.
Analytics and reporting tools
Analytics and reporting tools are indispensable for tracking the performance and effectiveness of social media customer service efforts. These tools should provide valuable insights into customer interaction patterns, response times, and customer satisfaction levels.
Detailed reports help teams understand how they can improve their social media strategy and enhance the overall customer experience. By monitoring key metrics, companies can make data-driven decisions to boost customer loyalty and refine their customer service solutions.
Multi-channel support
Multi-channel support is critical for excellent customer service across all social media channels. The best social media customer service solutions integrate platforms like Facebook, Twitter, Instagram, and WhatsApp into a single interface, allowing the customer support team to manage all customer queries without needing to switch between different apps.
Real-time notifications for customer messages and social media posts ensure swift responses, thus maintaining high customer satisfaction. By offering comprehensive support across various social channels, businesses can enhance their customer interactions and cultivate strong customer loyalty.
Comparison of top platforms for 2025
As social media continues to shape the customer service landscape, selecting the right social media customer service platform is crucial. In 2025, top solutions include LiveAgent, Zendesk, Sprout Social, Salesforce Service Cloud, and other notable options. Each offers unique features to enhance customer interactions across various social channels.
LiveAgent
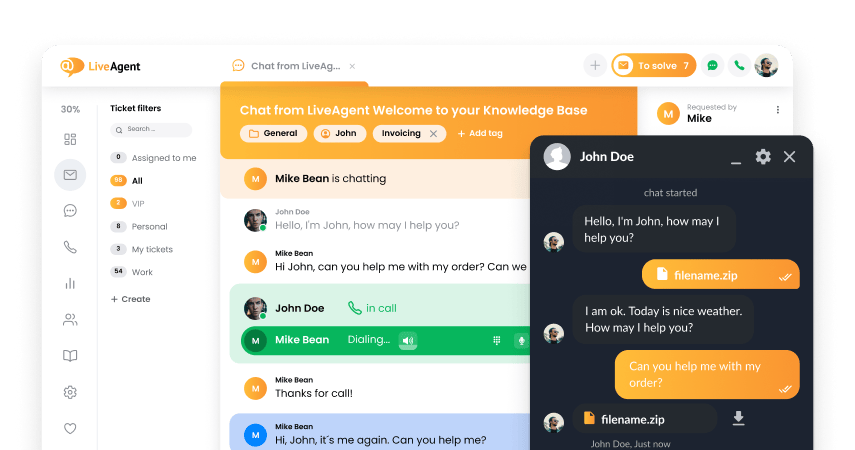
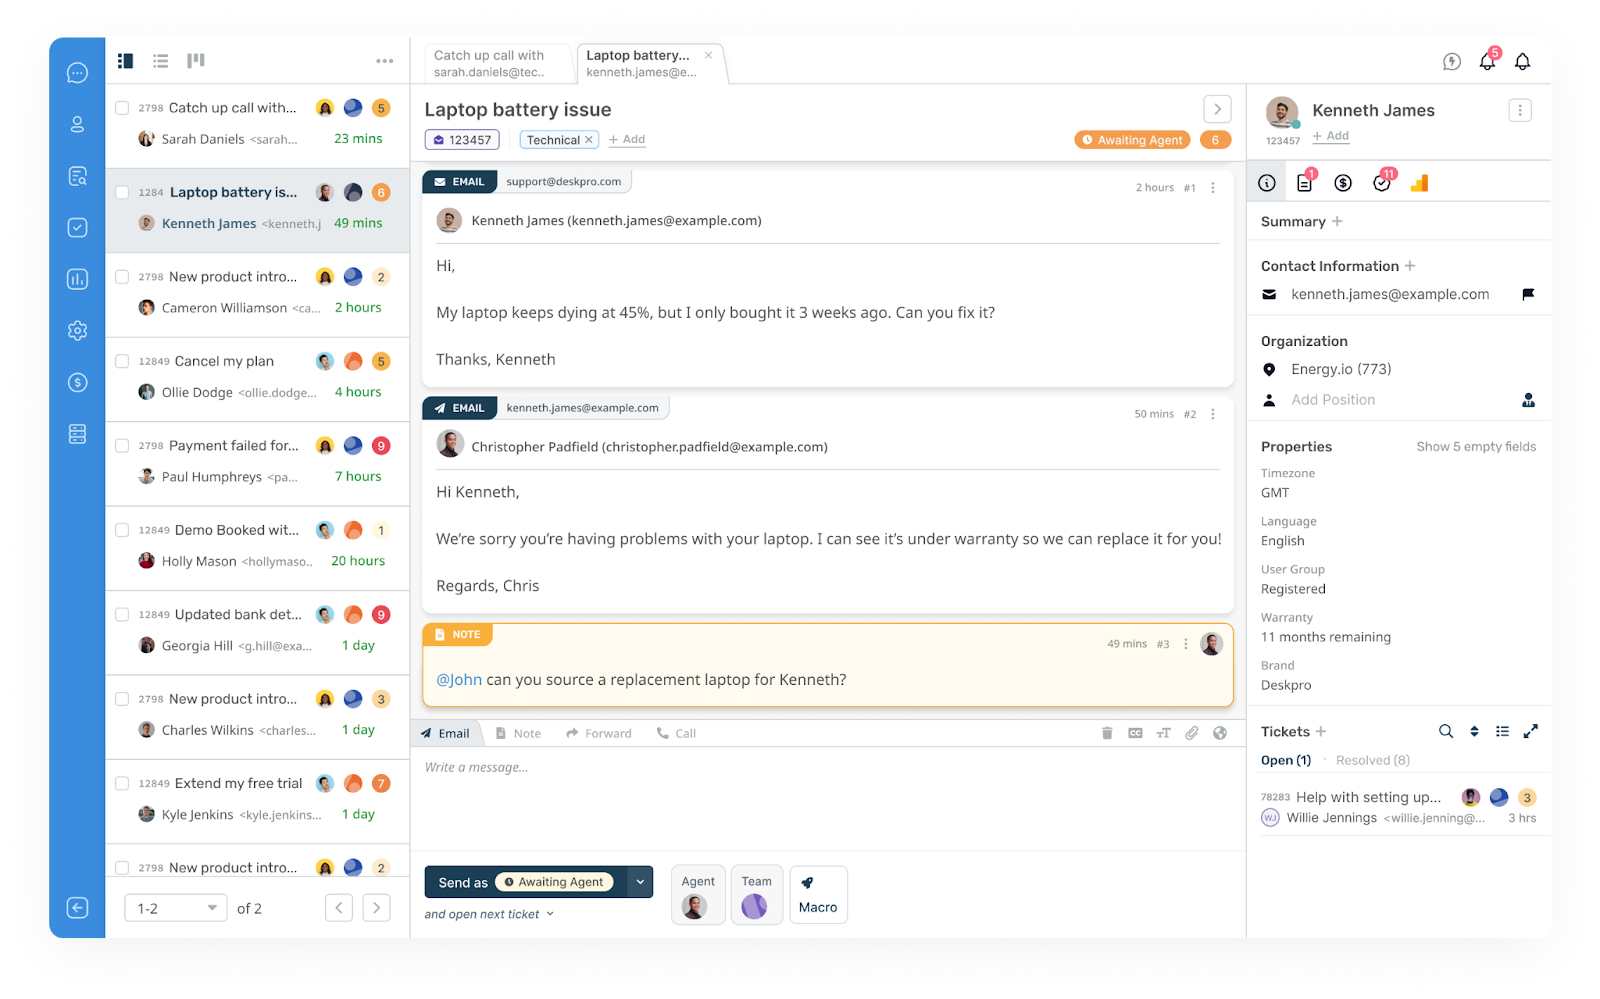
LiveAgent stands out as a comprehensive help desk solution that brings together customer interactions from multiple social media platforms. Its Universal Inbox feature streamlines customer service inquiries from various social channels into a single, easily manageable dashboard. This organization aids customer support teams in handling a large volume of messages more efficiently.

The platform’s custom automation rules allow users to automate interactions, boosting response efficiency and ensuring a timely resolution of customer inquiries. LiveAgent also excels in ticket assignment, directing specific customer service needs to the right experts. This targeted approach ensures that customer queries are addressed accurately and efficiently.

Additionally, LiveAgent’s robust reporting tools offer insights into social media interactions, supporting businesses in refining their overall customer support strategies and enhancing customer experience.
Zendesk
Zendesk’s comprehensive Support Suite enhances customer service operations with automation rules based on keywords, hashtags, or triggers. Its social listening capabilities help agents track customer conversations for valuable insights.

The platform integrates with over 1,500 apps, including social media tools like Sprout Social, allowing extensive customer support capabilities. Zendesk simplifies communication across public and private channels, improving the overall customer experience.
Sprout Social
Sprout Social offers a unified social inbox to track messages and comments from various social media platforms. The platform provides powerful analytics and reporting tools to understand customer insights better.

With AI and ML technology, it extracts insights from social conversations. Sprout Social’s features support omnichannel communication and enhance the customer journey with integrated CRM systems and scheduling tools for curated social content.
Salesforce Service Cloud
As part of the Salesforce ecosystem, Service Cloud integrates seamlessly with other offerings for enhanced customer service operations. It supports effective management of customer communications and social media monitoring.

In 2025, Salesforce is integrating Meltwater to replace Social Studio for better social media capabilities. With AI-powered features, Service Cloud provides personalized responses, creating an efficient customer service experience.
Other notable solutions
Other notable social customer service software includes Sprinklr and Qualtrics CX for Contact Centers. Sprinklr offers a comprehensive platform for social media management, while Qualtrics focuses on customer feedback and insights collection. Solutions like Gorgias provide unique functionalities such as omnichannel support and AI-driven automation, catering to various business needs in 2025.


Provide excellent customer service
Discover unparalleled customer support with LiveAgent's all-in-one software. Benefit from 24/7 service, a free trial without a credit card, and seamless integration across 130+ ticketing features. Enhance your business with fast setup, AI assistance, live chat, and more. Choose LiveAgent for exceptional service and satisfied customers.


Our website uses cookies. By continuing we assume your permission to deploy cookies as detailed in our privacy and cookies policy.