
Introduction
This article covers customer service essentials, emphasizing its importance for businesses, impact of poor service, and necessary skills for agents. It highligh...
7 min read
Customer experience
Customer service
+1

Excellent customer service holds significant business value as it directly affects the company’s relationship with its customers, and ultimately, its bottom line. If a business affords excellent customer service, it could mean the difference between a one-time shopper and a loyal, lifelong customer.
Customer service, in simple words, is the support a company provides to its customers before, during, and after a purchase. It forms the backbone of any business, connecting the consumers with the brand. It involves professional treatment and support to customers, answering their queries, solving their issues, and guiding them through various processes.
In modern terms, customer service interactions aren’t just limited to face-to-face conversations or over the phone. These days, the definition of customer service is all about offering convenience, personalized experiences, and speed to the customer. To fully understand the nuances, it’s also important to explore the debate of customer support vs. customer service.
Furthermore, in a fiercely competitive business environment where products and services are increasingly commoditized, proactive customer care becomes a competitive advantage. It not only helps in building trust and brand loyalty but also enhances the value proposition of a business. A customer who consistently has positive customer service experiences is more likely to become a repeat customer and show a higher level of brand engagement.
Imagine you buy a product, and it somehow doesn’t work as expected. Naturally, you go back to the store, visit their website, or call them for help. It’s the job of their customer service team to assist you, guide you through the problem, maybe replace the product, or arrange for a refund.
That’s how customer service works. When you strip it down to its basics, it’s all about addressing issues and queries whilst maintaining a professional and pleasant attitude towards customers. And not just at the point of sale, but throughout the lifecycle of the product or service.

This is why the phrase “customer service is key” is often used. It means that having top-notch customer service is crucial to the overall success and reputation of a business. Happy customers tend to come back to make more purchases and recommend your business to others, and they may even be willing to pay more for consistent outstanding service.
A customer support system or customer service system refers to a range of technical and operational strategies, tools, and practices that a company uses to interact with its customers. This system helps in handling customer concerns, complaints, queries, feedback, suggestions, and any other form of interaction that the business has with its clients.
A customer service system is essential for maintaining customer satisfaction and promoting positive customer experiences. This can be achieved through various communication channels like emails, phone calls, websites, live chat, social media, and so on.
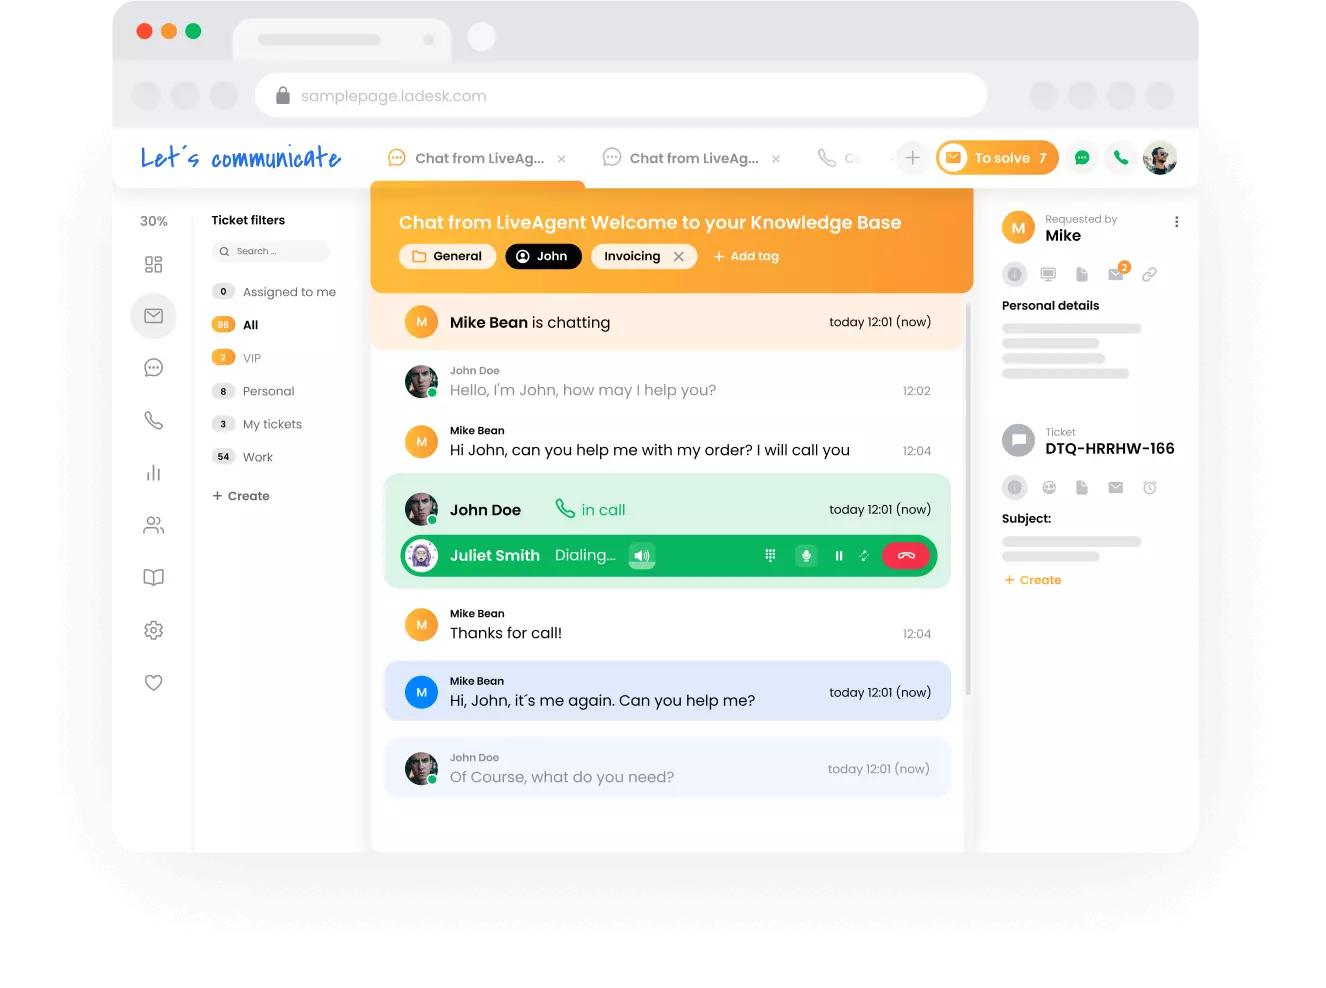
LiveAgent customer service software is an all-in-one solution that helps businesses manage all their customer interactions from one centralized place. It allows the company to integrate multiple communication channels, making it easier to respond to all customer queries promptly and maintain a consistent message.
Start your free trial today and see results within days.
Exceptional customer service is key to the success of any business. It is a combination of several essential elements:
Personalization: This refers to how services are tailored to meet the specific needs of each customer. To provide personalized services, you need to understand each customer’s unique needs and preferences.
Empathy: Empathy involves understanding and sharing the feelings of your customers. In the context of exceptional customer service, empathy involves showing your customers that you genuinely care about their problems or experiences. This helps in building strong relationships with customers, which can translate to increased customer loyalty and satisfaction.
Responsiveness: Reacting quickly and effectively to customer queries or complaints is essential for exceptional customer service. Responsiveness goes hand-in-hand with listening and understanding: it is not just about answering quickly, but also ensuring that your response effectively addresses the customer’s concerns.
Product knowledge: This constitutes a deep understanding of your products or services. It gives you the ability to provide detailed information about your products, guide customers on how to use them, or troubleshoot any issues the customers may be experiencing.
Professionalism: This is the way you conduct business and interact with your customers. Professionalism inspires confidence and trust in your customers. It includes maintaining a level of etiquette, using proper language, respecting the customers’ time, being honest, and upholding the highest ethical standards.
Let’s look at some of the most common types of customer service you can provide:
Phone: This is one of the most traditional and commonly used types of customer service. It allows customers to call in and speak directly with the customer service team about any issues, concerns, or questions they may have.
Text: This type of customer service enables customers to send a text message to customer service reps for help. It’s a convenient option for those who may not be able to talk on the phone.
Live chat: Live chat is a type of online communication that allows customers to instant message customer service representatives directly on the company’s website. It often provides immediate responses and quick solutions.
In-person: Sometimes customers require in-person service, such as in retail environments. Here, salespeople or staff assist them by answering their queries or helping them find what they need.
Social media: With an increase in social media use, many companies now use these platforms for customer service. Customers can reach out via direct messages or comments on businesses’ social media channels like Facebook, Instagram, or X (Twitter), and companies can respond publicly or privately.
Self-service: This can include FAQs, tutorials, and other resources provided by the business that allow customers to find solutions to their problems or answers to their questions on their own. Self-service tools may also include interactive voice response systems that guide callers to solutions or automated online tools that provide answers or handle simple tasks. These services help customers solve their own problems quickly, without the need to reach out to a customer representative.
The latest tips and deals delivered straight to your inbox.
Of course, providing reliable customer service comes with its set of issues. Let’s quickly examine them.
Customer support teams often have to deal with customers who are dissatisfied, angry, or difficult to handle. This could test the patience and problem-solving skills of the customer service representative.
Solution: The best way to deal with difficult customers is to remain calm and polite, listen to their complaints or issues, and try to provide a solution that is satisfactory to them. It’s important to not take the customer’s anger personally and to strive to turn their negative experience into a positive one. A well-defined customer service process can greatly enhance customer satisfaction and efficiency.
Due to the fast-paced nature of business transactions, customers often expect their issues to be resolved instantly. Whether it’s a technical problem or a pricing issue, quick resolution is often challenging, particularly when resolving the issue involves several steps or the participation of other departments has to be requested.
Solution: Efficient processes and proper training can help customer service representatives to resolve issues quickly. Automation tools like chatbots can also reduce resolution time by handling common issues. It’s also important to set realistic expectations with customers about when their issue will be resolved.
The high volume of customers needing assistance or information can make it challenging for the team to provide consistent and top-notch service.
Solution: Continual training and consistent communication are key to maintaining high service quality. By providing team members with regular training on customer service skills and company policies, they can stay updated and continue to deliver excellent service.
Additionally, it’s helpful to have a well-documented customer service policy that representatives can refer to. It can also be beneficial to implement quality assurance measures such as monitoring customer interactions and collecting customer feedback for continuous improvement.
How can you provide the best customer support? Here are 7 best practices you can follow to ensure satisfied customers.
The key is treating each customer as a unique individual. Remembering past interactions, addressing them by their name, understanding their preferences, and having their history at hand goes a long way in fostering a good relationship. It creates an emotional connection, improves customer loyalty, and enhances customer satisfaction.
Ensure your customer service agents are well-acquainted with your products and services. Regular training of all your customer service personnel is vital as they will always act as the face of your business.
Clear communication alleviates misunderstandings. Ensure your customer service reps thoroughly understand the issue at hand and can explain solutions or processes clearly and understandably to the customer.
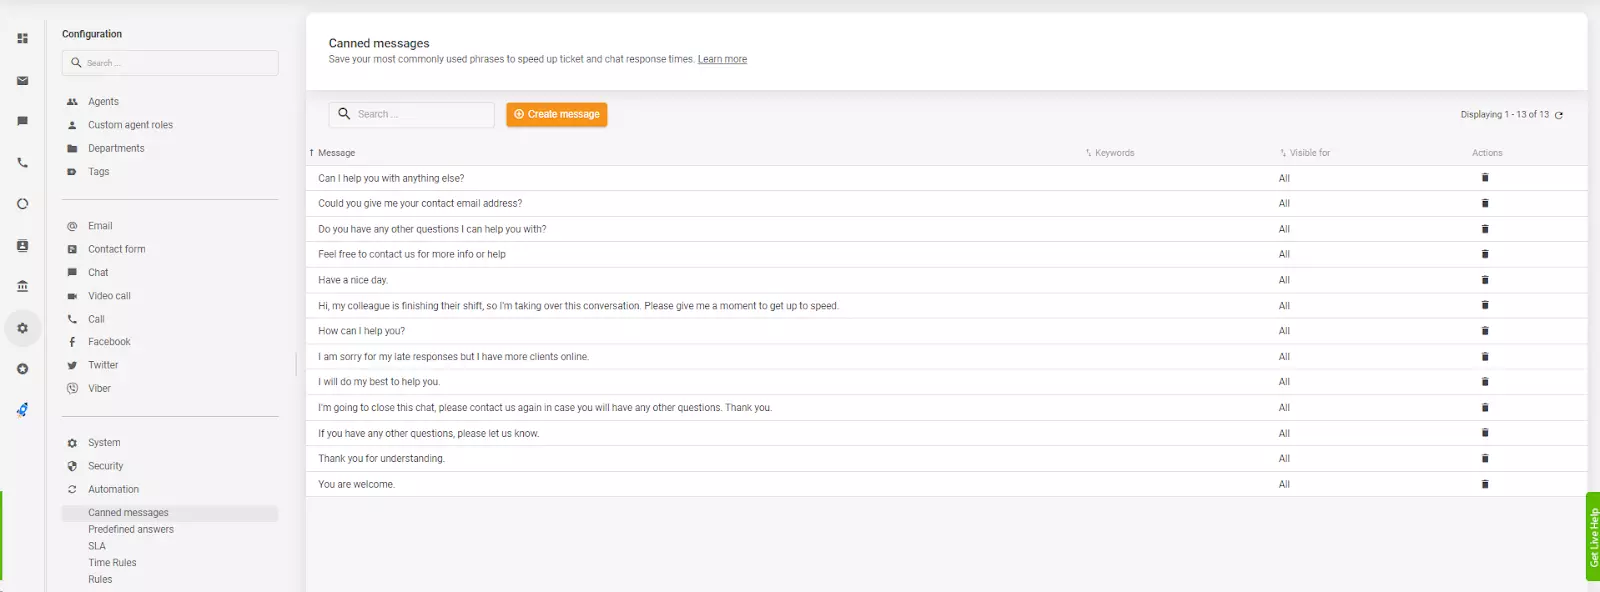
Automation helps businesses manage repetitive tasks so that their personnel can focus more on complex customer service issues. For instance, using AI chatbots or canned messages for frequently asked questions can lead to more efficiency.
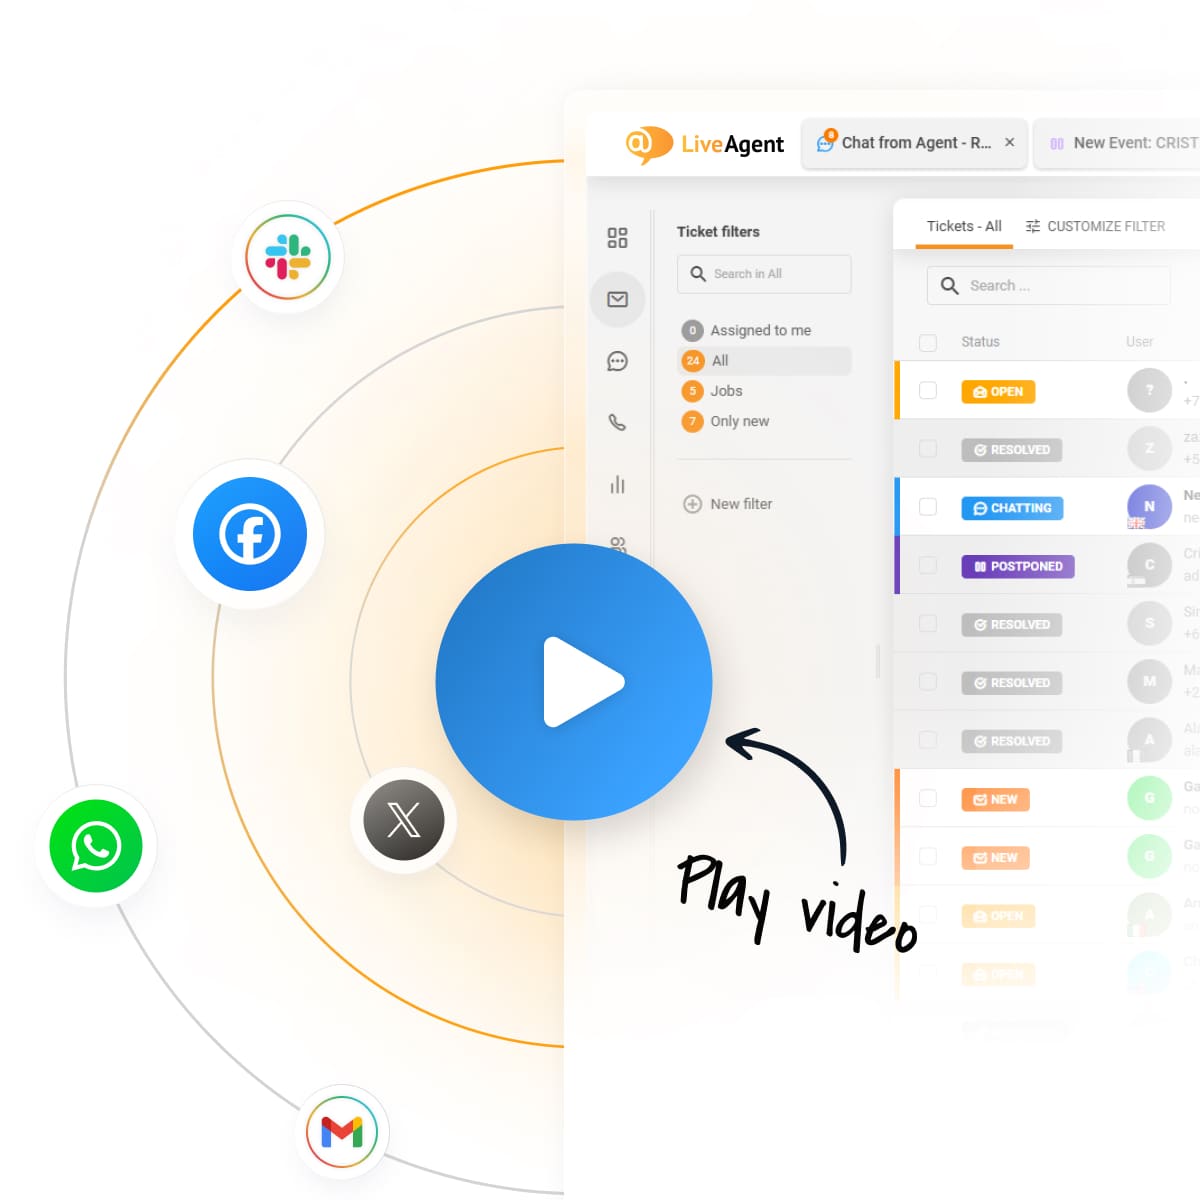
Customers today interact with businesses across various channels – email, social media, website, phone. Providing seamless omnichannel support ensures they receive a consistent and cohesive experience across all touchpoints.
Constantly seek to improve the quality of your customer service. This can be done by regularly gathering customer feedback and ensuring you’re meeting or exceeding their expectations.
If managing customer service in-house is overwhelming, consider outsourcing to a professional customer service provider.
Customer service job requirements generally include:
Communication skills: This involves effective speaking, active listening, and clear writing skills.
Empathy: An ability to understand and share the feelings of others, and to respond with appropriate empathy.
Problem-solving: The ability to identify problems and generate effective solutions for customers.
Technical knowledge: Knowledge about the products or services the company offers.
Patience: Some customers may be upset or difficult to deal with, so patience and understanding are key.
Adaptability: The ability to adapt to different types of customers and situations.
Multi-tasking: Handling several tasks at the same time, such as talking on the phone while using the computer.
Teamwork: The ability to work well with others in a team to provide the best customer experience possible.
If a team member is lacking these important skills, it could negatively affect the customer experience and the team’s overall performance. The person should be provided with constructive feedback highlighting where they need to improve and possible ways to achieve this. This could be in the form of additional training, coaching, or mentoring.
It might be beneficial for a new customer service rep to be paired with another team member who excels in areas they are struggling in to help shape their skills through observation and experience.
Reasonable customer service expectations are what customers can justifiably anticipate when they interact with a business. They expect their needs to be met and questions answered quickly and accurately. In terms of contact, they expect courteous, professional, and empathetic service, particularly in emotionally heightened situations.
Furthermore, customers expect the company to be reliable and transparent, meaning if there’s a mistake, the company admits it immediately and works towards rectifying it. They also anticipate consistency across different channels and touchpoints.
Staying on top of all this requires constant monitoring to make sure you are meeting these needs and setting goals accordingly. Setting SLA rules will not only help you define customer expectations but also employee accountability and your responsibilities as a provider. But keep in mind that incorrectly set SLA rules can cause more damage than good.

To set SLA rules that work, you first need to understand the needs and the usual expectations of the customers in your industry. Secondly, be realistic about the size and abilities of your staff. If you need to, hire staff or look into automation and self-service options to offload routine tasks.
Lastly, you should have a system to categorize and prioritize queries, so you don’t end up answering routine how-to queries instead of helping customers deal with critical system outages first.
Our 24/7 support team at LiveAgent sorts incoming queries according to department and priority level. We always strive to respond to all our tickets promptly, however, to balance our workload and meet expectations, especially during periods with a high volume of tickets, we have specific response time targets:
| Priority Level | Sales Support | Technical Support | Enterprise Support |
|---|---|---|---|
| Normal | First response: 2h, Next answer: 15h | First response: 8h, Next answer: 32h | First response: 1h, Next answer: 4h |
| High | First response: 1h, Next answer: 8h | First response: 4h, Next answer: 16h | First response: 30 min, Next answer: 1h |
| Urgent | First response: 30 min, Next answer: 1h | First response: 30 min, Next answer: 1h | First response: 15 min, Next answer: 30 min |
Note the ’next response" part. Each issue will be different and resolution times are much harder to adhere to. Sometimes people simply want to be sure you are doing your best to resolve their issues. Keeping your customers in the know about the progress and ETA will make them feel valued, in control, and more forgiving.
It’s hard to define customer service in the service industry, as it takes on a multifaceted role. Since the product is often intangible, the service experience itself becomes the product. As such, positive interactions, skilled communication, swift problem resolution, and a deep understanding of the consumers’ needs become essential components of a successful customer service strategy in this sector.
In the United States, customer service has a vital meaning as it is seen as the backbone of any business operations. It refers to the assistance and advice provided by a company to those people who buy or use its products or services. With customer loyalty being such a crucial aspect of the American market, businesses strive to provide excellent customer service to retain and extend their customer base.
It has been found that a staggering 96% of customers will sever relations with a company due to inadequate service. This statistic illustrates the sheer impact of the role customer service plays in sustaining or potentially ending a business relationship. Such a reality underlines the need for businesses to prioritize customer service, as the number of customers who will promptly exit the scene after a poor service experience is alarmingly high.
But what is customer service in the marketing world? In essence, a customer service approach in marketing entails using strategies and tactics that place the customer at the forefront of all operations. It is about delivering value at every touchpoint, addressing customer queries promptly, and resolving their issues effectively.
LiveAgent is one software solution that can help you enhance your customer service. This reliable help desk software provides a platform for effective communication and interaction with customers, ensuring they have a positive experience and your relationship with them remains strong and fruitful.

To bring the cost of customer service into perspective, different businesses are likely to encounter diverse customer service costs. These costs are generally hitched on various factors such as the size, scope, and nature of the business.
For instance, a global enterprise dealing with thousands of customer interactions daily will inevitably incur higher costs compared to a local business with minimal customer transactions. These costs can be attributed to factors such as hiring, training, and maintaining a high-quality customer service team, optimizing technological tools for customer service, and perhaps, even maintaining a physical customer service department.
But, taking into account the monumental repercussions of undervaluing customer service, these costs are simply a necessary investment. Ultimately, the aim is to provide a seamless and efficient service that satisfies customers while building a solid reputation for the business.
Interestingly, a statistic indicates that an increment of 2% in customer retention parallels profits as if costs were sliced by 10%. So it is no surprise that keeping your customers happy can increase your business’s bottom line.
Here are some other benefits organizations experience when they put in the extra work:
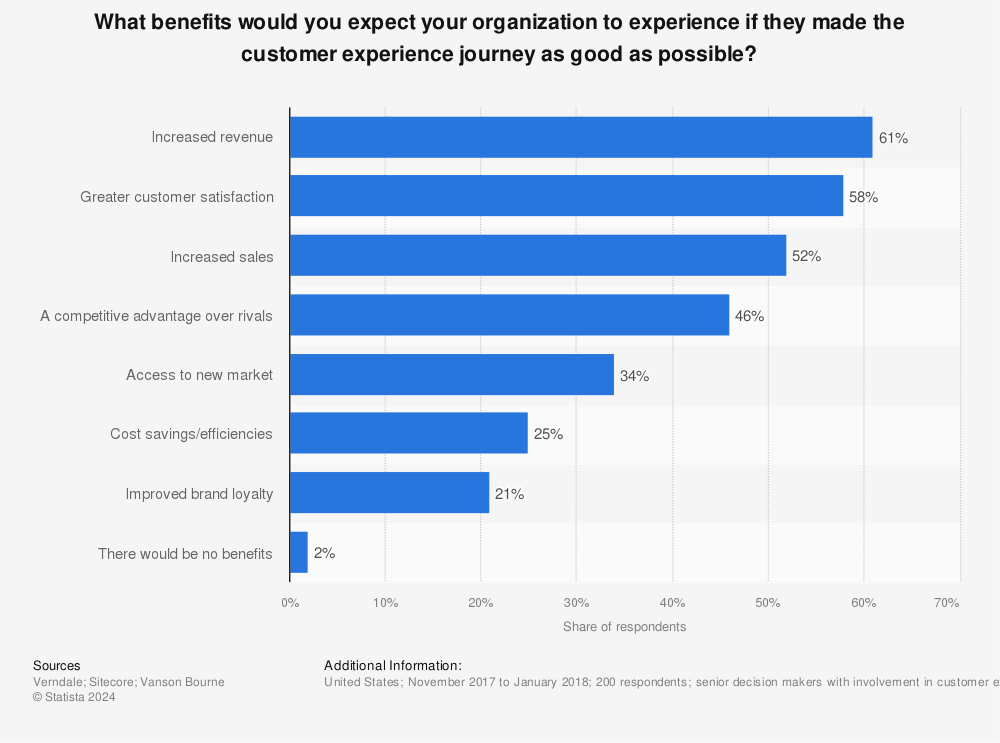
Firstly, holding on to your existing customers proves to be a cheaper alternative than acquiring new ones. This is mainly because the latter involves marketing costs and the uncertain possibility of conversion.
Secondly, customers are likely to shell out more for commodities if they’re assured of top-notch customer service. The reason is that customers appreciate a dependable, quick-to-respond customer service team that eliminates any potential buying or usage hitches.
Moreover, exceptional customer service means enhancing a customer’s lifetime value. By consistently delivering excellent customer service, you’re building customer loyalty which means customers are likely to stick around longer and continue purchasing from your business. This longer customer lifespan can lead to increased revenue over time.
Lastly, excellent customer service can act as a catalyst for additional revenue. Satisfied customers become ambassadors of your brand, making referrals to family and friends. This word-of-mouth marketing can generate new customers at no extra cost.
Let’s look at some ways you can bring your customer service to the next level:
Improve communication: The foundation of any stable customer relationship is good communication. From understanding customer needs to resolving their issues effectively, clear communication should be maintained.
Leverage technology: Use technology tools to streamline customer service like a CRM system to monitor and respond to customer queries, complaints, or feedback. Consider modern solutions, such as LiveAgent.
Prioritize prompt response and resolution: Customers prefer quick responses and resolutions to their problems. Ensure your customers don’t have to wait longer than necessary. Respond promptly and if resolution can’t be provided immediately, update them about the progress frequently.
Implement a customer feedback system: Implementing a system for gathering and analyzing customer feedback is crucial for service improvement. Feedback can enable you to understand what you’re doing right and the areas where you need to improve.
Strengthen relationships: Maintain regular contact with your customers. Newsletters, educational emails, and personalized offers can help in keeping customer interaction frequent and significant.
In conclusion, the customer service landscape in 2025 is a compelling blend of evolving customer expectations, advanced technologies, and refined service strategies. With the customer service definition continually metamorphosing, businesses need to fully grasp how customer service works, the various types and the challenges entailed, customer service trends, as well as the necessary components for excellent customer service.
Navigating the implications of excellent customer service for today and beyond may be challenging. Thankfully, you don’t have to do it alone. LiveAgent, equipped with state-of-the-art features, offers immense assistance in streamlining and enhancing customer service processes. Remember, excellent customer service isn’t an overnight achievement, but a continuous commitment. And the best part? You can try LiveAgent for free for 30 days and feel the difference it can make for your business. It’s time to raise the bar of your customer service and soar to new heights in the business landscape!
Deliver exceptional support across all channels with LiveAgent's award-winning help desk platform. Join thousands of satisfied businesses today.
This article covers customer service essentials, emphasizing its importance for businesses, impact of poor service, and necessary skills for agents. It highligh...
Explore the growing importance of customer service in enhancing customer experience. Learn 6 tips to boost satisfaction, retention, and revenue with effective s...
Master online customer service in 2025! Boost satisfaction with live chat, email, social media support. Learn best practices and tools. Try LiveAgent free!
Join our community of happy clients and provide excellent customer support with LiveAgent.

Cookie Consent
We use cookies to enhance your browsing experience and analyze our traffic. See our privacy policy.