
 Български
  Čeština
  Dansk
Dansk  Deutsch
  Eesti
Eesti  Español
  Français
  Ελληνικα
  Hrvatski
  Italiano
  Latviešu
  Lietuviškai
  Magyar
  Nederlands
  Norsk bokmål
  Polski
  Română
  Русский
  Slovenčina
  Slovenščina
  简体中文
简体中文  Tagalog
  Tiếng Việt
  العربية
  Português
-
![How to make an AI chatbot: A beginner’s handbook]()
How to make an AI chatbot: A beginner’s handbook
Explore our definitive guide for developing powerful AI chatbots from the ground up. Learn which key technologies and practical steps… Learn More
-
![Key benefits of chatbots for your business efficiency and customer retention]()
Key benefits of chatbots for your business efficiency and customer retention
Classic rule-based bots and chatbots have been helping enterprises for more than a decade now, but what about AI chatbots… Learn More
-
![How LiveAgent resolved 75% of chat interactions via the AI Chatbot]()
How LiveAgent resolved 75% of chat interactions via the AI Chatbot
LiveAgent operates a large SaaS website that attracts significant visitor traffic. While many visitors are interested in our product, a… Learn More
-
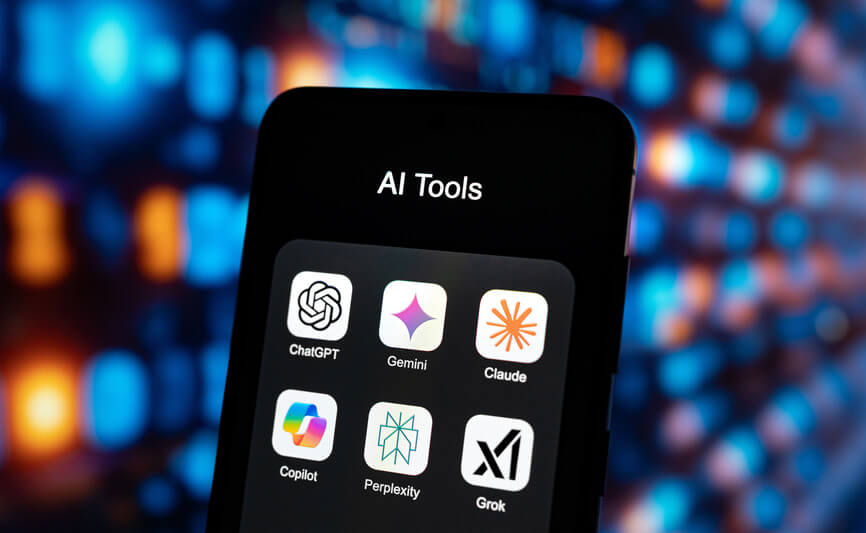
![What is the best AI Chatbot in 2025?]()
What is the best AI Chatbot in 2025?
We’ve reviewed the most popular AI chatbots and selected the top 5 best AI chatbots for you in this article.… Learn More
-
April 2025LiveAgent Monthly Update
![LiveAgent monthly updates: April edition]()
LiveAgent monthly updates: April edition
This month, our primary focus has been dedicated towards enhancing system performance and user experience. These enhancements range from minor… Learn More
-
![LiveAgent wins the Leader Award in multiple categories from SourceForge]()
LiveAgent wins the Leader Award in multiple categories from SourceForge
LiveAgent is proud to receive the Spring 2025 Leader Award in key customer service categories such as Help desk, Live… Learn More
-
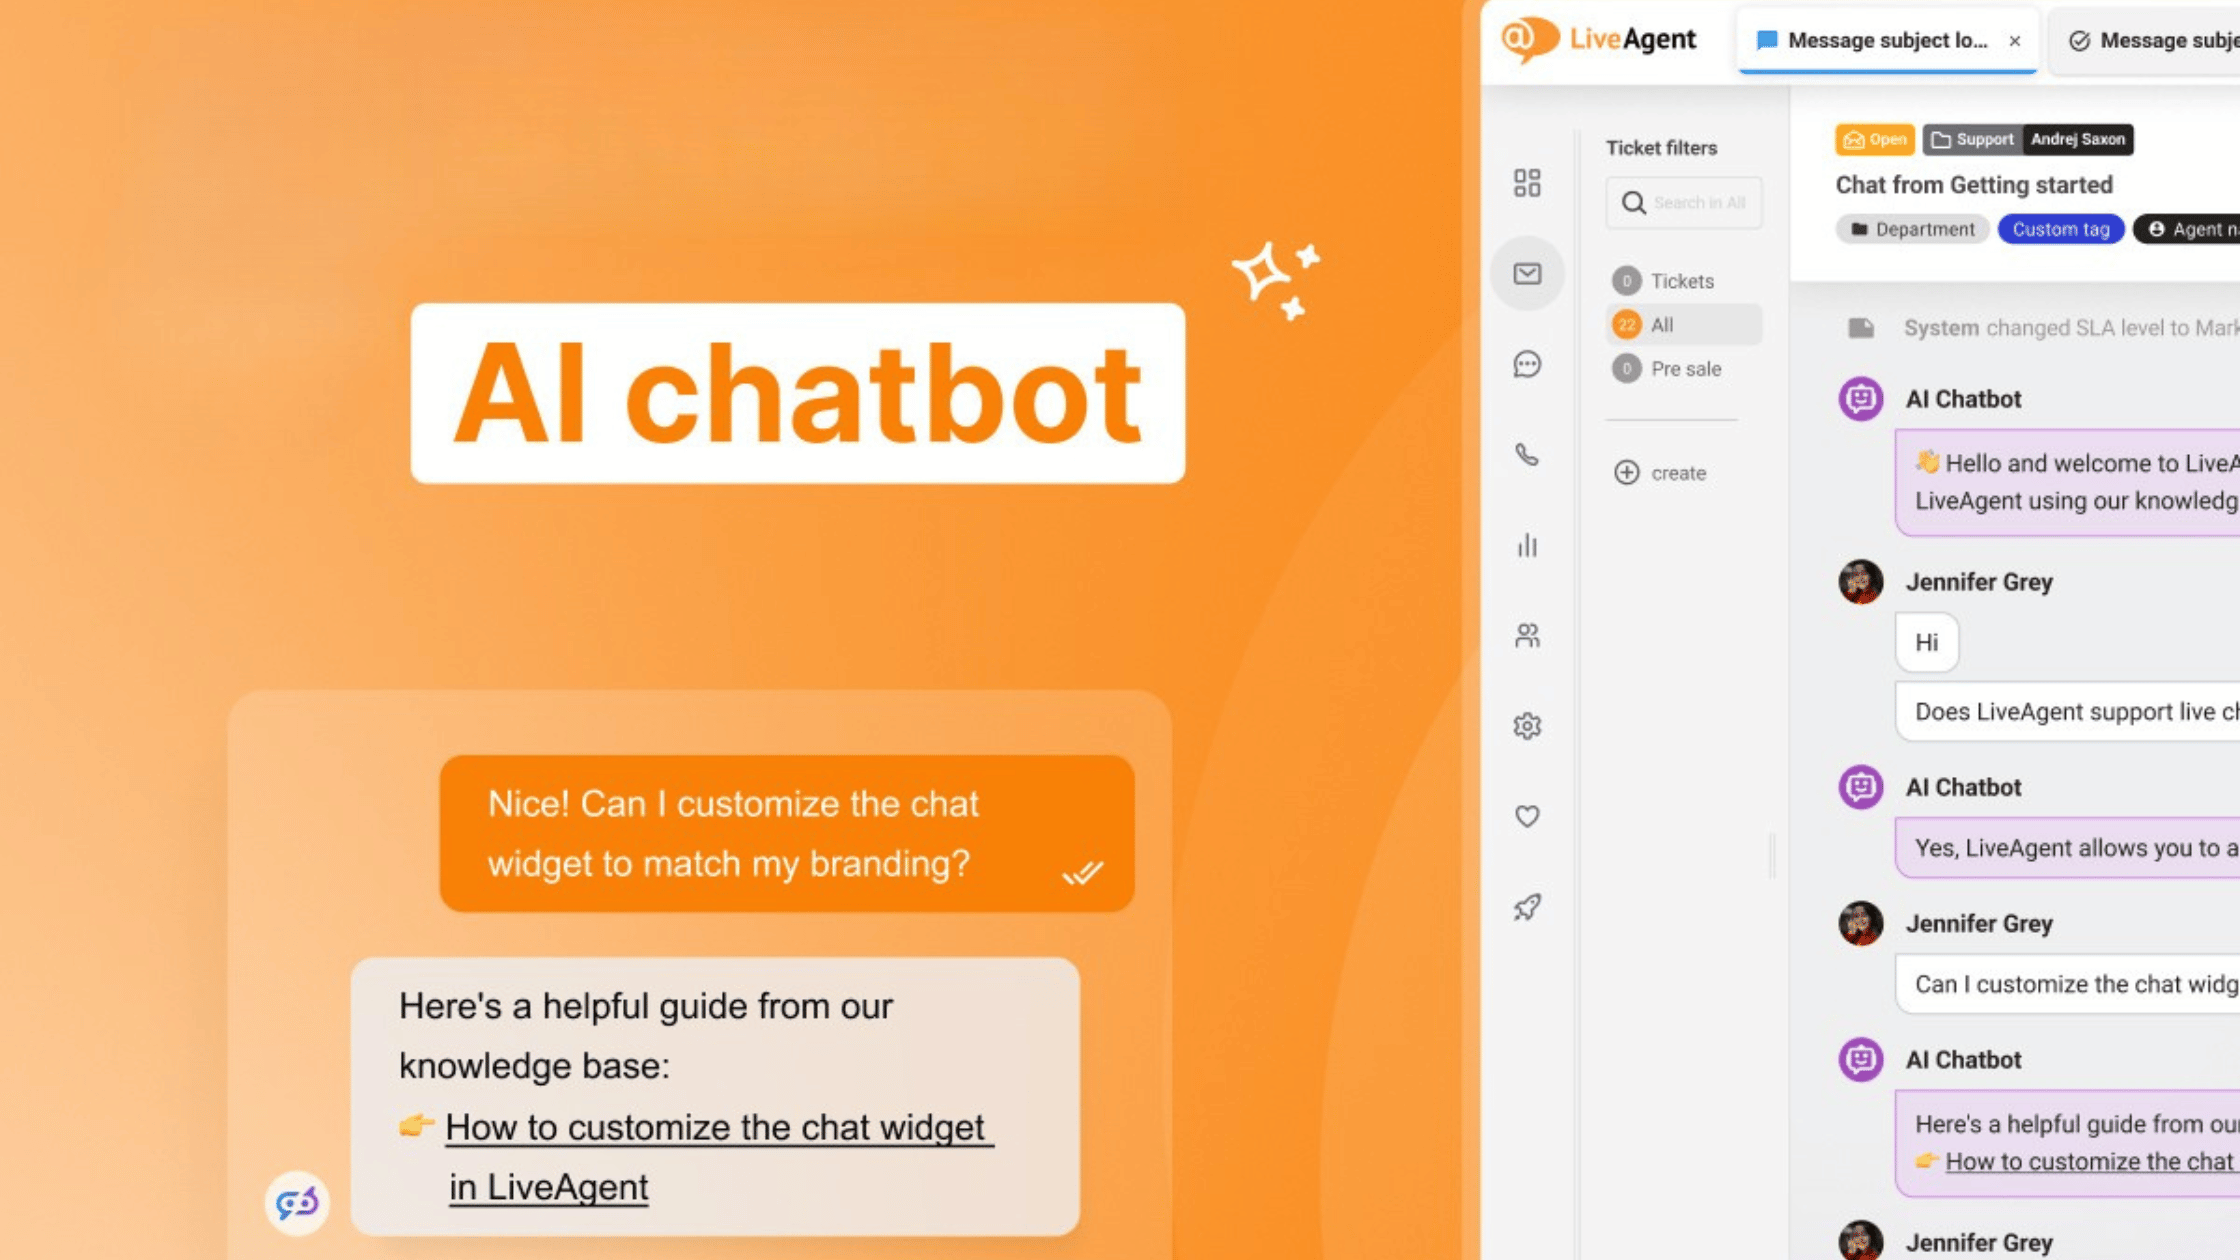
March 2025LiveAgent Monthly Update
![LiveAgent monthly updates: March edition]()
LiveAgent monthly updates: March edition
March brings the exciting announcement of the launch of the LiveAgent AI Chatbot, delivering on our promise to enhance customer… Learn More
-
February 2025LiveAgent Monthly Update
![LiveAgent monthly updates: February edition]()
LiveAgent monthly updates: February edition
This month, we are excited to share some positive advancements to LiveAgent. We will give you a sneak peek at… Learn More
-
![LiveAgent recognized as a Category Leader 2025 in customer support by GetApp]()
LiveAgent recognized as a Category Leader 2025 in customer support by GetApp
LiveAgent is proud to announce that we have been recognized as a Category Leader in Customer support software category for… Learn More


Our website uses cookies. By continuing we assume your permission to deploy cookies as detailed in our privacy and cookies policy.