Explore key call center statistics for 2026, including average handle time, first call resolution, and customer satisfaction metrics. Gain insights into industry-specific performance, AI adoption, and challenges to enhance customer service efficiency and satisfaction.
Published on Jan 20, 2026 by Lucia Halašková.Last modified on Jul 14, 2026
Human brain tends to compare things, to put labels on them, to be able to categorize them. Some may argue that it is not right, but this approach helps us to set benchmarks, evaluate our positions, and, consequently, have greater motivation to advance. And who does not want to improve, become better?
In this article, we offer you the most up-to-date and relevant call center performance metrics and statistics, a helpful tool for making your call center the cherry on top of your customer service. Are you ready? Let’s go!
Call Center Top Statistics
Firstly, what is call center? The history of call centers began in the 1960s; however, the term ‘call center" emerged in the 1980s. With the vision of providing as excellent customer service as possible, companies started to dedicate specific teams to handling only calls. The first company to adopt this model was Birmingham Press and Mail in the UK in 1965, which used an Automatic Call Distributor (ACD) to handle customer calls.
Nowadays, call centers have an irreplaceable position in many industries. Here are some of them:
Banking & financial services: When it comes to money, every client needs the most relevant and up-to-date information about their finances. Banks are widely reported to keep their call center customer satisfaction rate at around 79%.
Insurance: Good quality customer service is an alpha and omega also for companies in the insurance industry. Well-tailored, personalized service in a call center is consistently linked to meaningfully higher customer retention in this sector, though the exact percentage varies a lot between studies.
Healthcare: The most common reasons clients contact call center agents here are appointment scheduling, patient inquiries, and telehealth services. That is why the abandonment rate in healthcare stays low, averaging around 7% (Sprinklr, 2025), with most benchmarks placing the industry range between 5% and 8%.
Telecommunications: The agents in telecommunication call centers primarily handle technical assistance and billing inquiries. By 2025-2026, an estimated 95% of telecom providers have adopted AI to improve the quality of their support, up sharply from just a few years earlier.
The call center world capital is located in the Philippines. You may ask why. It is mainly the high literacy rate, cost-effective solutions, progressive government policies, and a neutral English accent of local agents that make companies decide to outsource their call center customer service here.
The average salary for a call center representative in the Philippines is around $4,400 to $6,800 per year (roughly ₱21,000-32,000/month, per 2025 data from Digido and PITON-Global). In Switzerland, they can earn around CHF 58,500 per year, with entry-level roles starting near CHF 40,700 and senior agents reaching CHF 58,300+ (Glassdoor/SalaryExpert, 2025).
Average Handle Time Statistics
This metric represents the average time of a call, of a ticket resolution, basically, the amount of time required to help the customer. It includes hold time, talk time, and any related post-call work. Keeping track of the AHT can be beneficial in many ways.
For instance, you can boost your productivity and customer satisfaction rate while also being able to use your resources more effectively. For example, if a contact center knows its AHT is 6 minutes and it expects 100 calls per hour, it can allocate around 10 agents (considering some buffer for breaks and non-call activities) to handle the workload efficiently.
It is being said the lower the AHT, the better. But keep in mind that quality should come first. Too low AHT can make your customers feel you don’t respect them enough. These days, the AHT is 6 minutes and 10 seconds (Sprinklr, 2026 benchmark data), but it surely depends on the industry. Worth noting: call centers using AI-assisted agents are reporting 20% to 35% lower AHT than teams working without it. Nevertheless, to get the most accurate information about your performance, you can use the following formula:
AHT = (Total talk time + Total hold time + Post-call tasks) / Total number of customer calls
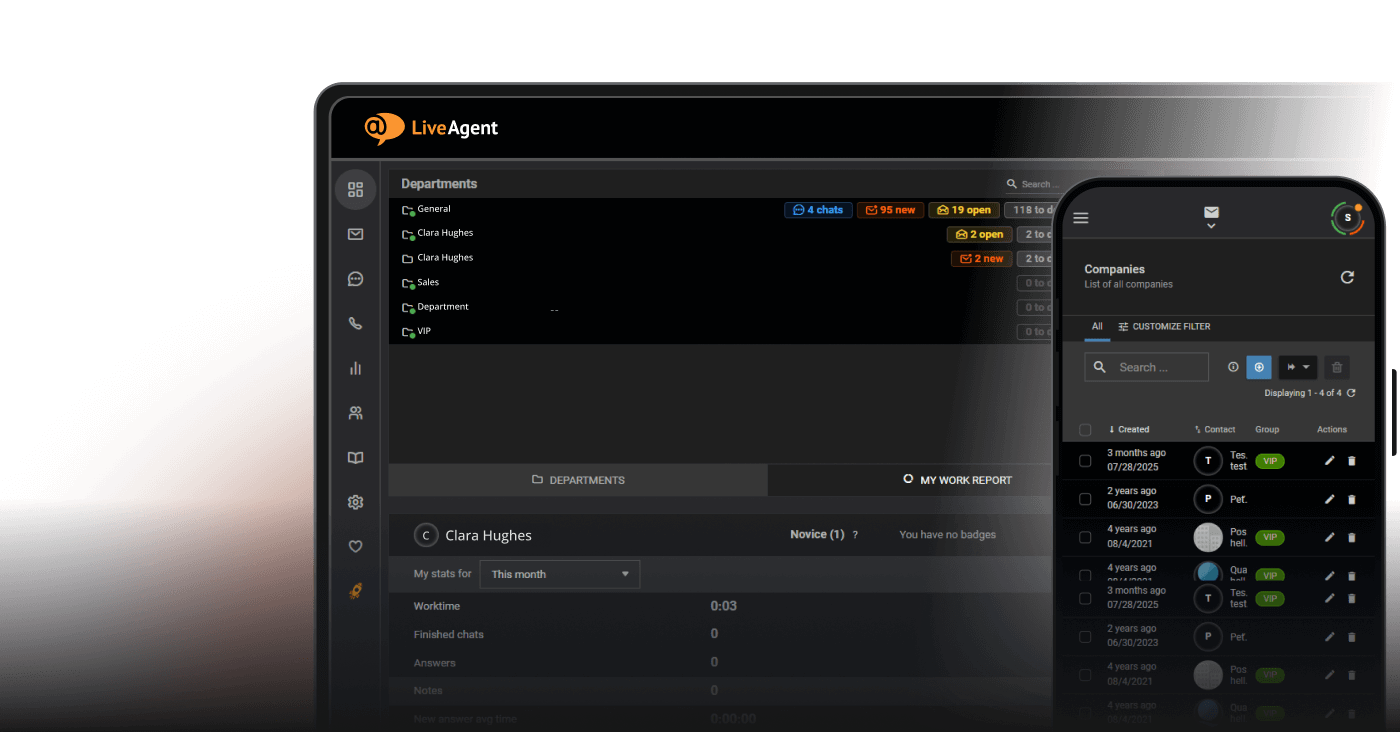
You can also take advantage of help desk software equipped with this functionality. LiveAgent, for example, can give you a leg up here.
Now, let’s take a closer look at each part of AHT:
Average talk time: As you can already figure out, this metric represents the amount of time an agent spends on a call with a customer. To give you some numbers, the average talk time these days is 3.35 minutes.
Average hold time: This metric measures the average length of time agents put customers on hold during a customer call. According to Giva, 66% of customers reach their patience limit once hold time hits the two-minute mark. This illustrates the importance of prompt reaction to customer inquiries to ensure their satisfaction with your services.
Post-call tasks: The statistics on follow-up times can be sparse and industry-specific. Nevertheless, they are important. Are you wondering, what could be a post-call task? Here are some examples:
Resolving customer requests from call
Sending follow-up emails with link to knowledge base articles related to discussed topic
Sending, processing the record of consultation, if customer requested it
Reporting more complicated issues to specific departments
Simple ‘Thank you for your time" emails to show that you value your customers and their time
Ready to grow your business?
Start your free trial today and see results within days.
The first call resolution rate, or FCR, is another important metric we should pay attention to when talking about call center statistics. This rate represents the amount of customer queries resolved during their first call, without further need for follow-ups or escalation. According to SQM Group, the first call resolution rate is often the top priority of a customer.
Globally, SQM Group puts the average first call resolution rate at 70%, with 70-79% considered a “good” score and 80%+ classified as “world-class” — a bar only around 5% of call centers actually clear.
Fun fact: SQM Group’s latest research identifies 38% agent attrition/turnover as the single biggest driver behind declining FCR scores in 2025 — a reminder that keeping experienced agents on the floor is just as important as the tools and data you give them.
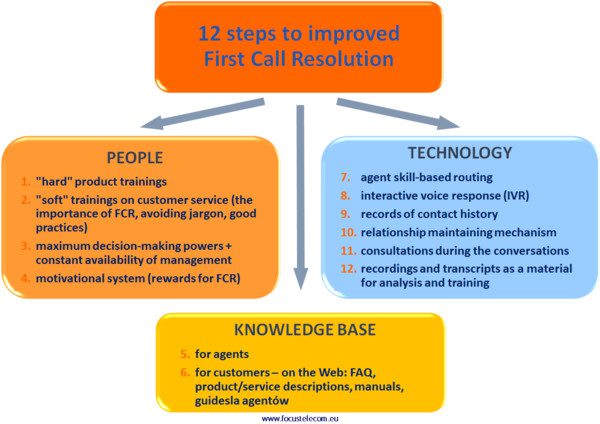
Do you want to improve your FCR rate? Follow these 12 easy steps; focus on:
People
“hard” product training
“soft” training on customer service (the importance of FCR, avoiding jargon, good practices)
maximum decision-making powers + constant availability of management
motivational system (rewards for FCR)
Knowledge base
for agents
for customers (FAQs, product/service descriptions, manuals, how-to guides)
Technology
agent skill-based routing
interactive voice response (IVR)
records of contact history
relationship maintaining mechanism
consultation during the conversation
recording and transcripts as a material for analysis and training
Response Time Statistics
The average speed of answer (ASA) is around 28 seconds in general. This metric represents the amount of time that the agent needs to pick up the call after it has been routed to them. But how can you evaluate if your ASA is sufficient? Current 2026 benchmarks (CallBotics/Orvera) break it down by tier: under 10 seconds is considered excellent, 10-20 seconds good, 20-30 seconds acceptable, and anything above 30 seconds needs improvement.
It is important to state that agents need some time between calls to note down all the information in the database and rest before the next incoming call. However, these periods shouldn’t be too long.
Join our newsletter
The latest tips and deals delivered straight to your inbox.
Call Abandonment Statistics
We already noted that nowadays, customers are really sensitive to being put on hold, which ultimately leads to call abandonment. Patience wears thin fast: most customers will hang up within a few minutes of being kept waiting, and the exact tipping point varies by industry and channel.
Generally, the industry’s average call abandonment rate varies around 6%, with 2025-2026 benchmarks (Brightmetrics, Balto, SQM Group, ICMI) placing the healthy range between 5% and 8% — high performers stay under 5%, while anything above 10% is flagged as a problem. To fulfill the customer expectations, you can take advantage of LiveAgent’s automatic call back feature or call routing feature.
Service Level Statistics
This metric is another crucial key performance indicator that can help the call center manager boost agent efficiency and maintain customer loyalty. It impacts call center efficiency by providing insights into how well it meets customer demand and response times. Based on service level statistics, managers can set targets, such as answering X percentage of calls within Y seconds, to ensure optimal performance.
For example, a common target is 80/20, meaning 80% of calls should be answered within 20 seconds. This benchmark dates back to legacy phone-system defaults from the 1970s, and in 2025-2026 more call centers are flexing it to fit their specific needs — think 90/15 for premium support lines, 80/30 for technical support, or 95/10 for emergency services. Practical strategies for meeting these targets include optimizing staffing schedules, using call routing technology, and providing ongoing agent training to handle calls more effectively.
Customer Satisfaction Statistics
What is the main goal of every call center? Obviously, making their customers happy and providing them with outstanding customer service. It is being said that you always have to start with yourself. For example, according to Invoca, improving agent job satisfaction can boost customer satisfaction scores by 62%, alongside a 56% gain in efficiency and a 39% increase in retention.
Happy customers are the essence of every successful business. It’s no surprise that 91% of callers with a negative experience will not return to the company. In other words, do not underestimate the value of customer feedback. Customer surveys can be a helpful tool here.
Customer satisfaction is mostly measured and expressed by CSAT, the customer satisfaction score. Naturally, this score can vary from one call center industry to another, but current 2025-2026 benchmarks treat 75% to 85% as “good,” with 78% being the cross-industry average and 85%+ considered “world-class.”
As we said, customer expectations are increasing. According to HubSpot, 90% of customers now say getting an immediate response is important, and 60% expect that response within just 2 minutes. Fulfilling these expectations can pay off since happy, satisfied customers are 38% more likely to give you positive feedback and recommend your business than the ones with bad experiences.
Occupancy Rate Statistics
As we noted above, balance is key to the satisfaction of both your employees and your customers. The occupancy rate is closely connected to balance. It measures how busy your agents are; it shows the time agents spend handling calls versus their idle or available time. However, do not confound the occupancy rate with the agent productivity. Productivity refers only to the time the agent spends handling calls.
Generally, the occupancy rate is measured on a team level, not individually. According to Simply Contact and Calabrio’s 2025 Call Center Productivity Guide, the healthy range for occupancy sits between 85% and 90% — pushing much past 90-95% consistently is a strong predictor of agent burnout.
It is only up to the call center leader to choose the best-fitting strategy. Usually, to prevent burnout of contact center agents, companies tend to monitor call volumes, predict traffic patterns, and utilize self-service options to reduce the burden on agents during peak times. During quieter periods, engaging agents in outbound calls, using different communication channels, or training can be useful to optimize productivity.
Understanding Customer Preferences According to Generations
Different generations usually have different preferences. What type of customer support is the most suitable for each of them? And which generation is most likely to choose a phone call to address a company? A March 2025 Forbes/Prosper Insights survey shook up the old assumptions here — Gen Z, in particular, turns out to be far less “anti-phone” than most articles claim. Find out in our updated table.
Generation
Preferences
Communication Style
Less Likely to Use
Baby Boomers
Still lean on phone calls to resolve issues, but 68% now also use chat apps for support.
Expect formal, respectful communication.
Personalized/AI-driven outreach — 37% actively reject it.
Generation X
Time-saving solutions, most often live chat, phone call, or email communication.
Efficient, formal, helpful communication with support.
Social media, apps.
Millennials
Tend to choose omnichannel support; 87% use their smartphone for service, and 85% are open to AI agents as long as they can escalate to a human.
Prefer a casual, conversational tone.
Being locked into a single channel.
Generation Z
Self-service and fast resolutions come first, but 86% still chose phone for retail/travel service issues in the Forbes survey, and 84% are open to AI agents if human escalation is available. Only 7% reject personalized outreach outright.
Value transparency, authenticity, and speed.
Slow, impersonal, single-channel support.
Call Center Technology Statistics: Utilization, Adoption Rates, and Impact of Technology
Companies are rapidly integrating advanced technologies to enhance call center performance and boost customer satisfaction rates. To date, about 49% of businesses have adopted call center software. This number is expected to increase as 24% of organizations plan to implement these solutions over the next two years.
We certainly cannot omit AI when discussing technology’s impact on call centers. Estimates vary quite a bit by firm and scope, but Grand View Research’s 2025 projection puts the market for AI in call centers at roughly $2 billion in 2024, growing to over $7 billion by 2030 — a 23.5% CAGR. Gartner, meanwhile, forecast back in 2022 that 2026 would be the watershed year when conversational and agentic AI cut contact center agent labor costs by $80 billion — a prediction the industry is now watching closely as the milestone year arrives.
AI can have a positive impact on both customer service agents and customers. Using AI, agents can focus on more complex tasks, leaving repetitive tasks to AI. On the other hand, customers can get the answers and the required information faster, which can result in better CX.
These days, almost 70% of companies use AI-based technologies in call centers, and some surveys put full AI adoption in some function as high as 81-88%. But adoption isn’t the same as impact: current data points to a real deployment-operationalization gap — as many as 88% of contact centers are deploying AI at scale, yet only around 25% have it fully integrated into daily workflows. Where it is properly operationalized, tier-1 AI support is resolving roughly 65% of issues without any human intervention. That is why most businesses’ investments are mainly in AI automation. This includes:
AI voice bots which provide customer support 24/7
AI agent assist tools that can improve your agents’ productivity
AI speech analytics can get you insights into customer behavior, trends, preferences, and points of frustration; in other words, help you better understand your customers
AI call summary, thanks to which you can come back to the conversation and look for strong or weak points, and review the situation from a different perspective
Customer Experiences in Call Centers
Customer experience (CX) drives over two-thirds of customer loyalty, outperforming brand and price. PwC’s landmark “Experience Is Everything” research found consumers will pay up to a 16% price premium for a good experience — and a newer PwC “Loyalty Illusion” survey from October 2025 shows just how costly getting it wrong has become: 52% of consumers stopped using a brand after a single bad product or service experience, with 29% citing poor CX specifically as the reason.
As we already stated, customer expectations tend to increase rapidly nowadays. According to HubSpot, 89% of customers expect an email reply within an hour — yet the actual average response time runs closer to 12 hours, a gap that’s only growing more visible to customers.
To make sure your customers get the best possible experience, it is essential to provide self-service resources. Zendesk’s 2026 CX Trends report finds 61% of customers now prefer self-service for simple issues, though live chat and messaging have actually overtaken self-service in real interaction volume — accounting for 45% of interactions versus self-service’s 32%.
Still not convinced about the importance of good CX for your call center? The classic PwC figure still holds up: up to 32% of customers would stop doing business with a brand they loved after just one bad experience — and the 2025 data above suggests that number, if anything, has only grown.
Good Customer Experience in Call Center
When was the last time you bought clothes online? Try to think about it and remember what contributed to your positive experience, if there were one. Do you have it? Right, do you find yourself in some of the following situations?
The online shop with clothes puts a big emphasis on first call resolution. You need to return the T-shirt you bought because it doesn’t fit you. Since the call center agent helped to resolve your problem, you spared a lot of time, which improved your experience with the store.
During the call, the agent proposed you take another size according to your previous orders. They basically offered you personalized service. Such a service can ensure your customers are satisfied, and satisfied customers often become loyal customers.
When you asked the agent about their return policy, they were unsure about one slight detail. You have not noticed anything since the company has implemented AI, which helped the agent to look for the information you asked for.
Bad Customer Experience in Call Center
Sometimes, our experiences with call centers are just not that rose-colored. Let’s keep our example with the purchase of a T-shirt and make another roleplay.
First of all, you were transferred several times to different agents. That has cost you not only a lot of energy to explain your problem again and again but also a lot of time. The agent did not show any empathy, and on top of that, they were rude.
What impression does it leave? Naturally, not the good ones. Apart from the agent’s behavior, good-quality customer service software can be of big help here. LiveAgent comes equipped with the opportunity to create a comprehensive, well-structured knowledge base that can lead you through the whole return process. Thanks to its CRM integration, the information about your order is available for every agent, so you do not have to repeat it several times.
Biggest Challenges in Call Centers
Staff and agent retention is one of the biggest challenges a call center must face in 2026. In the U.S., the turnover rate varies between 30% and 45% annually (QATC), which makes it difficult to maintain good quality customer service. Best-in-class centers keep attrition under 15%, and SQM Group research shows roughly a 26-point CSAT gap between low-turnover and high-turnover teams — another reason FCR and CSAT scores suffer when agent retention slips. With the rise of AI in customer service came many opportunities but also many challenges. Sometimes, it can be difficult to keep up with the latest trends.
On the other hand, remote work may have seemed like a challenge before the COVID-19 pandemic. Today, a lot of issues have been mitigated thanks to the adoption of cloud-based solutions, secure remote access technologies, and robust management tools. These days, call centers efficiently operate with remote teams, proving that initial challenges can be successfully addressed with the right strategies and technologies.
Many call center agents struggled with the enormous amounts of tickets before, and, let’s face it, it was often quite difficult to keep track of the ticket resolution and be informed about progress. Nowadays, you can choose from many available features that call center software offers.
Satisfied users of LiveAgent underline the automation rules and tagging function. Assigning several rules to one tag can spare your team a massive amount of valuable time. On top of it, tickets in your call center are organized, labeled, and who doesn’t like to keep things systematically organized?
Conclusion
To sum up, we offered you valuable insight into the most critical call center statistics, from the first call resolution, through call abandonment stats, to the occupancy rate statistics. Keeping in mind these metrics and comparing your company’s score with the average times, numbers, and statistics can help you to point your call center toward success.
We’ve seen that customer satisfaction is crucial in every aspect. It lays the foundations for your success. That is why it is important to work with tools that can help you keep your CSAT as high as possible. LiveAgent meets all the prerequisites for this, and, moreover, it gives you an opportunity to try all its functionalities for free for 30 days.
Share this article
Lucia is a talented WordPress content editor who ensures the seamless publication of content across multiple platforms.
Lucia Halašková
WordPress Content Editor
Frequently asked questions
The average answer rate for call centers can vary widely based on industry, time of day, and region. However, a typical benchmark ranges between 70% to 80%. It indicates the percentage of incoming calls answered by a customer service agent within a specified timeframe, reflecting the call center efficiency.
The average number of calls a call center makes each day can vary significantly depending on its size and focus. However, smaller centers may handle around 50 to 100 calls per agent daily. In comparison, larger, more automated call centers can manage several hundred to over a thousand calls daily per agent.
The most common reasons are long wait times, poor issue resolution, unhelpful agents lacking empathy or knowledge, technical problems like call drops, and a lack of personalized service. These contribute to negative CX and highlight the need for efficient call center operations, skilled agents, and effective communication to enhance satisfaction.
This market is expected to grow steadily, driven by rising demand for customer support, technological advancements, automation, and virtual call centers. Grand View Research projects a compound annual growth rate (CAGR) of around 9.8% through 2030, reflecting the expansion of digital communication channels and AI-driven service.
The decision depends on business needs, customer expectations, and service goals. Outsourcing can offer cost savings, expertise, and scalability, but companies must consider cultural differences and language barriers.
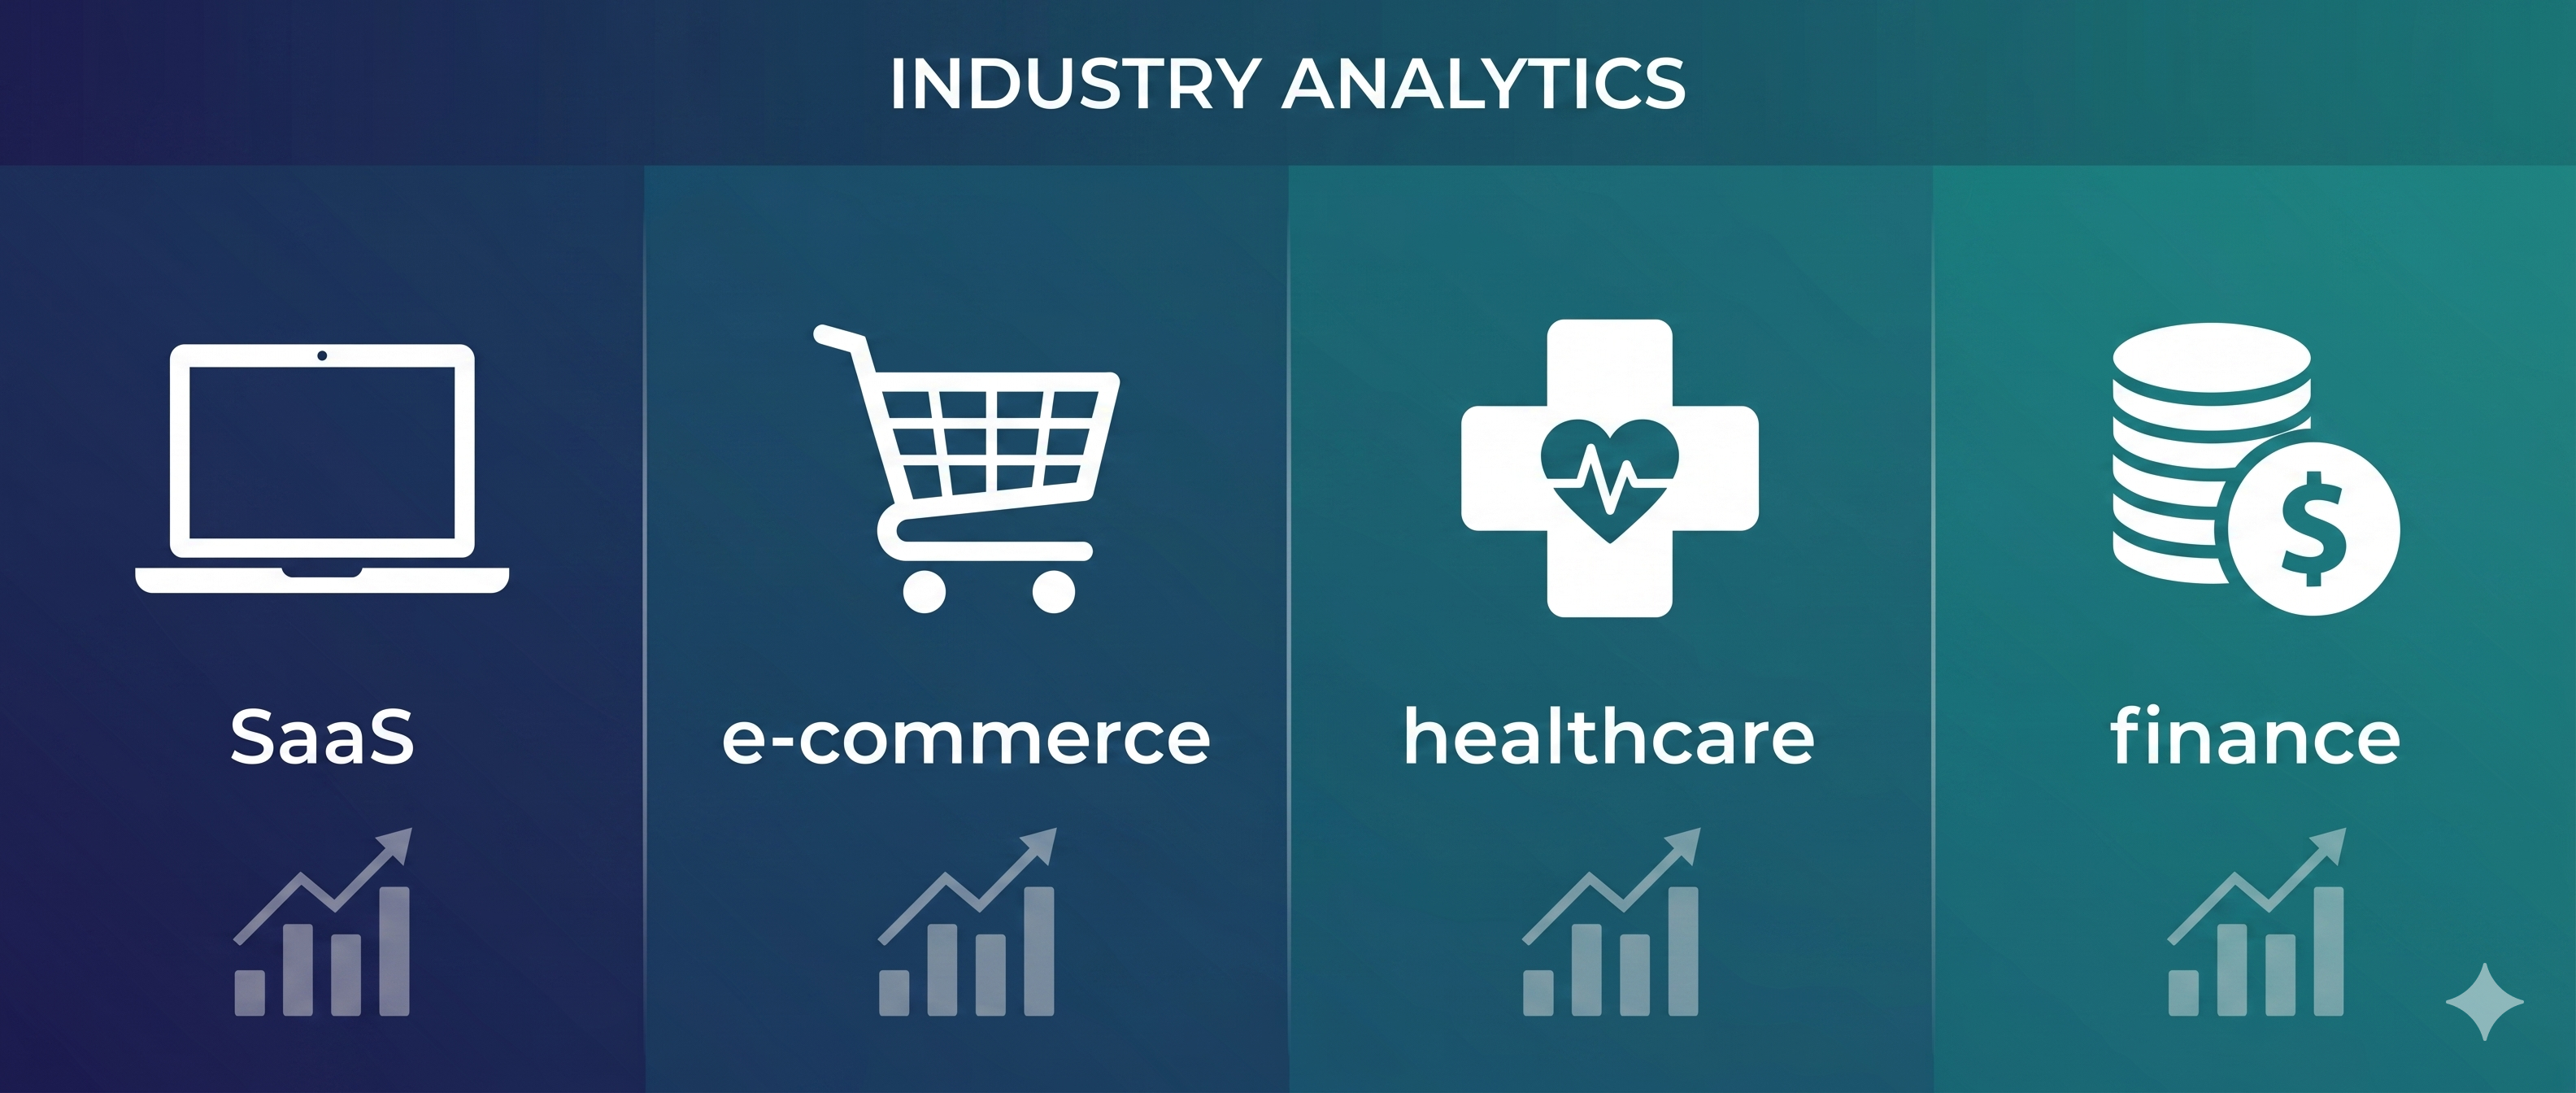
Call Center Benchmarks by Industry: SaaS, E-commerce, Healthcare, Finance
Industry-specific call center benchmarks for SaaS, e-commerce, healthcare, and finance teams. AHT, FCR, CSAT targets that actually apply to your sector.
Audit your call center's efficiency using a comprehensive checklist that includes performance metrics, agent efficiency, processes, scripts, recruiting, trainin...
Explore the top 12 call center metrics, including service level, ASA, FCR, AHT, and more, to enhance performance and track KPIs. Discover global benchmarks and ...
5 min read
Call Center Software
You will be in Good Hands!
Join our community of happy clients and provide excellent customer support with LiveAgent.