If your support team handles more than a handful of tickets each day, you already know the problem: not every issue deserves the same urgency, but without a clear system, agents end up making gut-level decisions that vary from person to person. One agent treats a payroll outage as critical while another marks it as medium priority and moves on. Over time, that inconsistency erodes SLA performance, frustrates customers, and buries genuine emergencies under a pile of routine requests.
A ticket triage priority matrix solves this. It gives every agent the same playbook for determining which tickets to pick up first, based on two objective factors: how many people are affected (impact) and how quickly the issue needs attention (urgency). The result is a priority level that everyone on the team can trust.
In this guide, you will learn exactly how to build a priority matrix for your own support operation, how to tie it to SLA targets, which metrics to track, and how to avoid the most common mistakes teams make when rolling one out. The process follows ITIL-aligned best practices but stays practical enough to apply in any helpdesk, whether you run a formal ITSM setup or a small customer support team.
Difficulty: Intermediate
Time to implement: 2-4 hours to define and configure; ongoing refinement over weeks
Prerequisites: Access to your helpdesk platform’s settings (admin rights to create custom fields, rules, or automation), a clear understanding of your SLA commitments, and input from at least one team lead or manager who can validate the impact and urgency definitions
What is a ticket triage priority matrix?
A ticket triage priority matrix is a two-dimensional grid that calculates priority from two inputs: impact and urgency. Impact measures the breadth and severity of the disruption. Urgency measures how quickly resolution is needed before the business suffers real harm. The cell where they intersect gives you a priority level, typically P1 (critical) through P4 (low).
In ITIL terms, priority is never a standalone judgment. It is always derived from impact and urgency. That distinction matters because it removes subjectivity. When an agent sees a ticket, they answer two concrete questions: “How many people or systems are affected?” and “How fast does this need fixing?” The matrix then does the rest.
The framework applies equally to IT incident management, customer support queues, and internal service desks. The labels might change (some teams use “severity” instead of “impact,” or “criticality” instead of “urgency”), but the underlying logic stays the same.
Why it matters for SLA performance: A correctly built priority matrix ensures that your SLA clock starts with the right urgency level attached. If a ticket is misclassified at intake, it either gets an SLA target that is too relaxed (causing delays for genuinely urgent work) or too aggressive (setting the team up for unnecessary breaches). Getting the priority right at the point of triage is the single most impactful thing you can do to protect your SLA compliance rate.
If your helpdesk platform supports automated ticket triage and categorization
, you can configure the matrix so that priority is calculated automatically the moment an agent selects impact and urgency values. This eliminates manual priority selection entirely and keeps your queue consistent.
Impact vs. urgency: understanding the two dimensions
Before you can build a matrix, your team needs a shared definition of what impact and urgency actually mean in your context. The definitions must be concrete enough that two different agents, looking at the same ticket, will assign the same values.
Impact: the scope of the disruption
Impact answers the question: “How many users, systems, or business processes are affected, and how badly?”
Impact is not about how upset the user is. It is not about which department filed the ticket. It is a measure of the factual scope of the problem. Common impact levels include:
High / extensive: Organization-wide outage, critical customer-facing service down, major revenue loss, security breach affecting multiple systems
Medium / significant: A department or team is affected, a secondary business function is degraded, or multiple users are impacted but a workaround exists
Low / minor: A single user is affected, the issue is cosmetic, or it does not interrupt core work
Tip: Tie impact levels to measurable thresholds where possible. For example: “High impact = affects 50 or more users OR a revenue-generating service.” This removes ambiguity.
Urgency: the race against the clock
Urgency answers the question: “How quickly does this need to be resolved before the damage compounds?”
Urgency is about time sensitivity. A high-urgency ticket is one where every hour of delay makes the situation worse. A low-urgency ticket can be scheduled without meaningful business consequences. Common urgency levels include:
High / critical: No workaround exists, operations are halted, a deadline is imminent, or the issue is actively escalating
Medium: Work is hindered but a temporary workaround keeps things moving, or the issue can wait a few hours without significant harm
Low: A reliable workaround exists, the issue can be deferred to a maintenance window, or the impact will not grow over time
Warning: Do not confuse urgency with impact. A single executive who cannot access email is highly urgent to that executive but has low impact (one user). A server issue affecting 200 people who have a manual workaround has high impact but moderate urgency. If you let urgency override impact, you will consistently over-prioritize loud individual requests while under-prioritizing widespread but quieter problems.
How to build your priority matrix
Building a functional priority matrix takes five steps. You can complete the first three in a working session with your team leads; the last two require admin access to your helpdesk platform.
Step 1: define your impact levels
Start by listing the impact levels that make sense for your organization. Most teams use three or four levels. Here is a starting point:
Impact level
Definition
Example
Extensive
Entire organization or all customers affected; core service unavailable
Payment gateway down for all users
Significant
Multiple teams or a major business function affected
CRM unavailable for the sales department
Moderate
A small group or secondary function affected
Printer offline for one floor
Minor
Single user or cosmetic issue
One employee cannot change their email signature
Adjust the thresholds to match your scale. A 500-person company might define “extensive” as 100+ users, while a 10-person startup might define it as 5+.
Step 2: define your urgency levels
Define urgency levels with clear decision criteria. The most common mistake here is relying on the requester’s tone rather than objective facts. Give agents a checklist:
Urgency level
Decision criteria
Example
Critical
No workaround; business loss is immediate and growing; deadline is right now
Ransomware attack encrypting files in real time
High
Workaround exists but is painful; resolution needed within hours
Email server down; users can use personal email temporarily
Medium
Reasonable workaround available; can wait until next business day
Software bug with a documented manual bypass
Low
No meaningful time pressure; can be scheduled
Feature request, minor UI glitch
Step 3: map the matrix
Now combine impact and urgency into a grid. The standard ITIL approach uses a 3×3 or 4×4 matrix. Here is a practical 3×3 version that works for most teams:
Impact ↓ / Urgency →
High urgency
Medium urgency
Low urgency
High impact
P1 — Critical
P2 — High
P3 — Medium
Medium impact
P2 — High
P3 — Medium
P4 — Low
Low impact
P3 — Medium
P4 — Low
P4 — Low
Larger organizations often expand this into a 4×4 grid by adding a “Critical” tier above “High” on both axes. That reserves P1 for the rare cases where impact and urgency are both at their most extreme, rather than letting every “high impact, high urgency” ticket land in the top band. It’s the same fix you’ll see later in this guide for taming a matrix that keeps compressing everything into P1 and P2.
Step 4: configure the automation in your helpdesk
Once your team agrees on the definitions and the grid, turn it into a form your help desk software
can actually enforce: two dropdown fields (impact and urgency) plus a rule or calculated field that sets priority from the combination. This is also the point where you connect each priority level to its own SLA policy, so the resolution clock starts with the right target the moment the ticket is created.
Step 5: test, monitor, and refine
Run the matrix on a subset of your queue, or in parallel with your existing process, before switching it on for everyone. Watch how tickets distribute across the four priority bands and check that the split feels realistic for your ticket volume. Once it’s live for the whole team, keep an eye on the SLA metrics and monitoring
covered below, and revisit the definitions on a quarterly cadence as real ticket data comes in.
Using automated ticket triage and categorization
removes the most common failure point in the process: agents manually selecting the wrong priority. When the matrix is enforced by automation, every ticket follows the same logic, regardless of which agent handles it.
Ticket triage SLA metrics and monitoring
Once your priority matrix is live, you need to track whether it is working. The goal is not just to assign priorities correctly but to see those priorities translate into better SLA outcomes.
Time from ticket creation to first agent acknowledgment
Measures how quickly customers hear back; broken down by priority
Mean time to resolution (MTTR)
Total time from creation to closure
Reflects overall efficiency; segmented by priority to spot bottlenecks
SLA compliance rate
Percentage of tickets resolved within their SLA window
The headline metric; aim for >95% on P1/P2
Time to assignment
Time from creation to when the ticket is assigned to an owner
A direct measure of triage speed; unassigned tickets are invisible work
Reassignment rate
How often tickets bounce between teams
High rates indicate broken routing rules or unclear categorization
Backlog age distribution
How many tickets are aging past their SLA window
Reveals whether the team is keeping up or falling behind
Monitoring: the dashboard that matters
Your operational dashboard should answer three questions at a glance:
What is about to breach? Show tickets at risk (75%+ of SLA time consumed) and tickets already breached. This is the most important view because it tells you where to direct attention right now.
How are we trending? Show SLA compliance over time (weekly, monthly), broken down by priority. A single compliance number can hide the fact that P1 performance is slipping while P4 performance is improving.
Where are the bottlenecks? Show reassignment rates by team, backlog by queue, and FRT by channel. If one team has a rising reassignment rate, the problem is likely triage, not capacity.
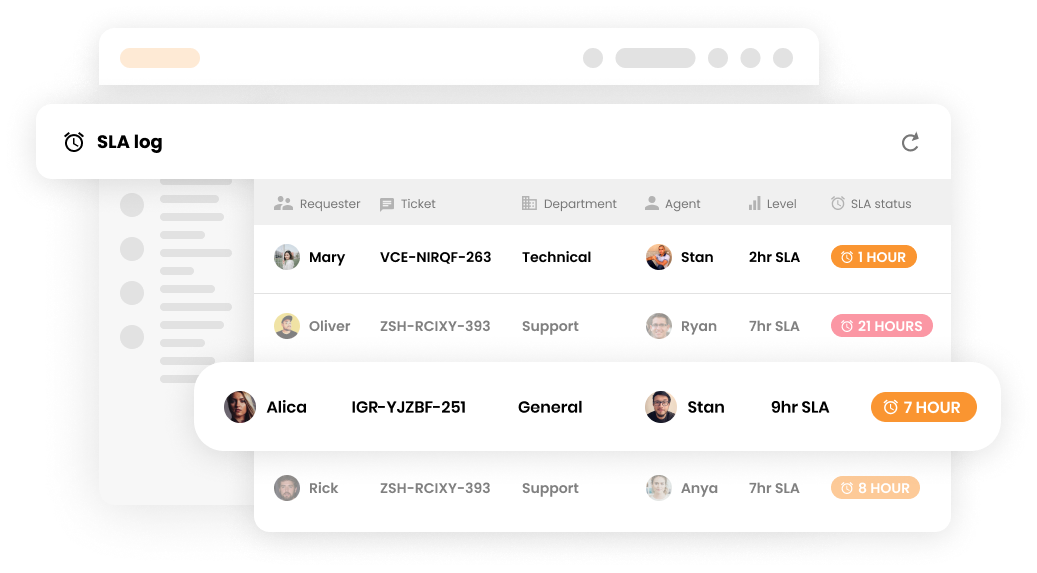
Use a color-coded SLA status for each ticket in the queue:
On track: >50% of SLA time remaining
At risk: 25-50% of SLA time remaining
Urgent: <25% of SLA time remaining
Breached: SLA deadline passed
Leading indicators of poor triage performance
Some metrics are lagging (you see the damage after it happens) and some are leading (they warn you before the damage spreads). Pay attention to these leading indicators:
Rising reassignment rate: Tickets are being routed to the wrong teams. Check your categorization rules and agent training on the triage and categorization
process.
Growing backlog in a single priority band: If P3 tickets are piling up while P1 and P2 are fine, your triage process may be over-classifying tickets to avoid P1 pressure.
Widening gap between FRT and time to assignment: If agents acknowledge tickets quickly but assignment takes hours, the triage step is the bottleneck.
Reopen rate above 5%: Tickets are being closed prematurely, often because the agent rushed to meet an SLA timer rather than fully resolving the issue.
Join our newsletter
The latest tips and deals delivered straight to your inbox.
Troubleshooting common priority matrix problems
Even a well-designed matrix can produce friction. Here are the most common problems and how to fix them.
Problem
Likely cause
Fix
Too many tickets land in P1
Impact and urgency definitions are too broad; agents are defaulting to “high” for both
Tighten definitions with measurable thresholds; add a “critical” tier above “high” so P1 is reserved for genuine emergencies
Agents ignore the matrix and assign priority manually
The matrix is not enforced by automation; agents have the ability to override
Remove manual priority selection from the agent form; make priority a read-only field calculated from impact and urgency
P3 and P4 tickets never get resolved
SLA targets for low-priority tickets are too loose; no accountability for backlog
Set a maximum age for P4 tickets (e.g., 10 business days); add a “stale ticket” alert for anything untouched in 5+ days
Reassignment rate is high
Routing rules are based on categories that agents misunderstand or misapply
Simplify the category taxonomy; add a “triage notes” field where agents can explain their routing decision; review misroutes weekly
SLA compliance is high but CSAT is low
Agents are gaming the SLA timer (acknowledging tickets quickly but not resolving them)
Track resolution time alongside FRT; measure first contact resolution as a quality metric
The “priority compression” trap
A problem that frequently appears on IT management forums is what practitioners call priority compression: too many tickets cluster in the same priority band because the definitions are too vague. When P2 covers everything from “department-level email outage” to “manager’s keyboard is sticky,” the matrix has lost its usefulness.
The fix is to make your definitions specific and, where possible, quantitative. Instead of “high impact = many users affected,” use “high impact = 50+ users affected OR a revenue-generating service is down.” Agents can apply this consistently.
Automating the priority matrix in your helpdesk
Automation is what turns a priority matrix from a reference document into an operational tool. When agents only need to select impact and urgency, and the system calculates everything else, your triage process becomes fast, consistent, and auditable.
Here is what a good automation setup looks like:
Agent selects impact and urgency from dropdown menus on the ticket form.
The system calculates priority using your matrix rules and sets the priority field automatically.
The SLA timer starts with the correct target based on the calculated priority.
If the ticket is unassigned after a threshold, the system escalates it to the team lead.
If the SLA timer reaches 75%, the system sends a warning to the assigned agent.
Most platforms, including LiveAgent
, support this kind of workflow through automation rules, SLA policies, and custom field logic. If your current platform does not support calculated priority fields, you can often achieve the same result with trigger-based rules: “When impact = X and urgency = Y, set priority = Z.”
For teams that want to go further, AI-powered triage can automatically classify incoming tickets based on historical patterns, detect sentiment, and suggest impact and urgency values before an agent even opens the ticket. This reduces the manual effort of triage and can cut time-to-assignment significantly. You can learn more about automated ticket triage and categorization
and how it integrates with SLA management.
FAQ
What is the difference between impact and urgency in a priority matrix?
Impact measures the scope of the disruption: how many users, systems, or business processes are affected. Urgency measures how quickly the issue needs resolution before the damage worsens. A server outage affecting 500 users with no workaround is both high impact and high urgency. A server outage affecting 500 users who have a reliable manual workaround is high impact but medium urgency. The matrix combines both to produce priority.
How do you define impact levels for IT service tickets?
Define impact levels with measurable thresholds. Start with the broadest level (organization-wide or all customers affected) and work down to the narrowest (single user, cosmetic issue). For each level, specify a user count or a service criticality trigger. For example: “High impact = affects 50+ users OR a core business service is unavailable.” This prevents agents from guessing.
What are the standard SLA response times for P1, P2, P3, and P4 tickets?
Common benchmarks are: P1 (critical) — first response within 15 minutes, resolution within 4 hours; P2 (high) — first response within 1 hour, resolution within 8 business hours; P3 (medium) — first response within 4 hours, resolution within 3 business days; P4 (low) — first response within 8 business hours, resolution within 5 business days. These should be adjusted to match your team’s capacity and contractual commitments.
Can a priority matrix be used for non-IT support tickets?
Yes. The impact-urgency framework applies to any support environment where incoming requests have different levels of urgency and scope. Customer support teams, facilities management, HR service desks, and MSPs all use variations of the same matrix. The labels change, but the logic is identical: assess scope (impact) and time sensitivity (urgency), then derive priority.
How do you prevent agents from overriding the priority matrix?
The most effective approach is to make the priority field read-only and calculated automatically from impact and urgency. If agents cannot manually change the priority, they cannot override the matrix. If your platform does not support calculated fields, you can use automation rules that set priority based on impact and urgency values and log any manual changes for audit review.
What metrics indicate that a triage process is failing?
Four leading indicators: rising reassignment rate (tickets going to the wrong teams), growing backlog in a single priority band, a widening gap between first response time and time to assignment, and a reopen rate above 5%. Any of these signals means the triage process needs attention, even if overall SLA compliance looks acceptable.
How often should a priority matrix be reviewed and updated?
Review the matrix quarterly. Look at the distribution of tickets across priority levels. If more than 10% of tickets are landing in P1, your definitions are likely too broad. If P4 tickets are consistently aging past their SLA, your targets may be unrealistic. Involve team leads and agents in the review; they will have the most useful feedback on where the matrix breaks down in practice.
Next steps
A priority matrix is not a document you create once and forget. The most effective teams treat it as a living framework, revisiting it every quarter, refining the definitions based on real ticket data, and retraining agents when the rules change.
Start with the 3×3 matrix in this guide. Define your impact and urgency levels with concrete thresholds. Configure the automation in your helpdesk. Run it for a month, review the priority distribution and SLA compliance data, and adjust. Over time, you will arrive at a matrix that fits your organization precisely and makes every triage decision fast, consistent, and defensible.
Impact measures the scope of the disruption: how many users, systems, or business processes are affected. Urgency measures how quickly the issue needs resolution before the damage worsens. A server outage affecting 500 users with no workaround is both high impact and high urgency. A server outage affecting 500 users who have a reliable manual workaround is high impact but medium urgency. The matrix combines both to produce priority.
Define impact levels with measurable thresholds. Start with the broadest level (organization-wide or all customers affected) and work down to the narrowest (single user, cosmetic issue). For each level, specify a user count or a service criticality trigger. For example: "High impact = affects 50+ users OR a core business service is unavailable." This prevents agents from guessing.
Common benchmarks are: P1 (critical) - first response within 15 minutes, resolution within 4 hours; P2 (high) - first response within 1 hour, resolution within 8 business hours; P3 (medium) - first response within 4 hours, resolution within 3 business days; P4 (low) - first response within 8 business hours, resolution within 5 business days. These should be adjusted to match your team's capacity and contractual commitments.
Yes. The impact-urgency framework applies to any support environment where incoming requests have different levels of urgency and scope. Customer support teams, facilities management, HR service desks, and MSPs all use variations of the same matrix. The labels change, but the logic is identical: assess scope (impact) and time sensitivity (urgency), then derive priority.
The most effective approach is to make the priority field read-only and calculated automatically from impact and urgency. If agents cannot manually change the priority, they cannot override the matrix. If your platform does not support calculated fields, you can use automation rules that set priority based on impact and urgency values and log any manual changes for audit review.
Four leading indicators: rising reassignment rate (tickets going to the wrong teams), growing backlog in a single priority band, a widening gap between first response time and time to assignment, and a reopen rate above 5%. Any of these signals means the triage process needs attention, even if overall SLA compliance looks acceptable.
Review the matrix quarterly. Look at the distribution of tickets across priority levels. If more than 10% of tickets are landing in P1, your definitions are likely too broad. If P4 tickets are consistently aging past their SLA, your targets may be unrealistic. Involve team leads and agents in the review; they will have the most useful feedback on where the matrix breaks down in practice.
Ticket Triage: A Complete Guide to Categorization, Prioritization & Routing
Learn how ticket triage works: the step-by-step process, the impact-urgency priority matrix, routing rules, automation levels, and the metrics that prove it's w...